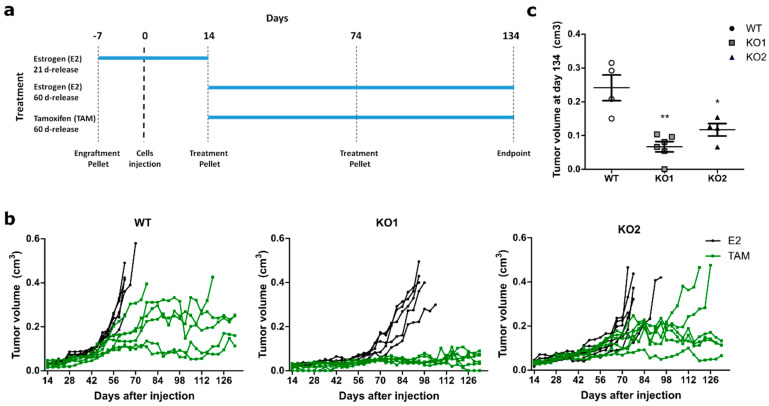
Figure 4.
ATF3 knockout impairs in vivo tumor growth upon tamoxifen treatment. (a) Schematic representation of the animal experiment. (b) Tumor volume over time up to 120 days of treatment. Tumor growth curves are plotted for mice treated first with an E2 21-day-release pellet (0.25 mg) seven days prior to injection with MCF7 WT or knockout cell clones. 14 days thereafter continuous treatment started with 60-day-release pellets consisting either of E2 (0.72 mg) or TAM (5 mg) throughout the experiment. Each line represents a mouse (n = 6 for each cohort) and each dot represents a measurement. (c) Tumor volumes of TAM-treated mice still alive at the experimental endpoint. Final tumor values represented as mean ± SEM. ** p-value < 0.01, * p-value < 0.05.

