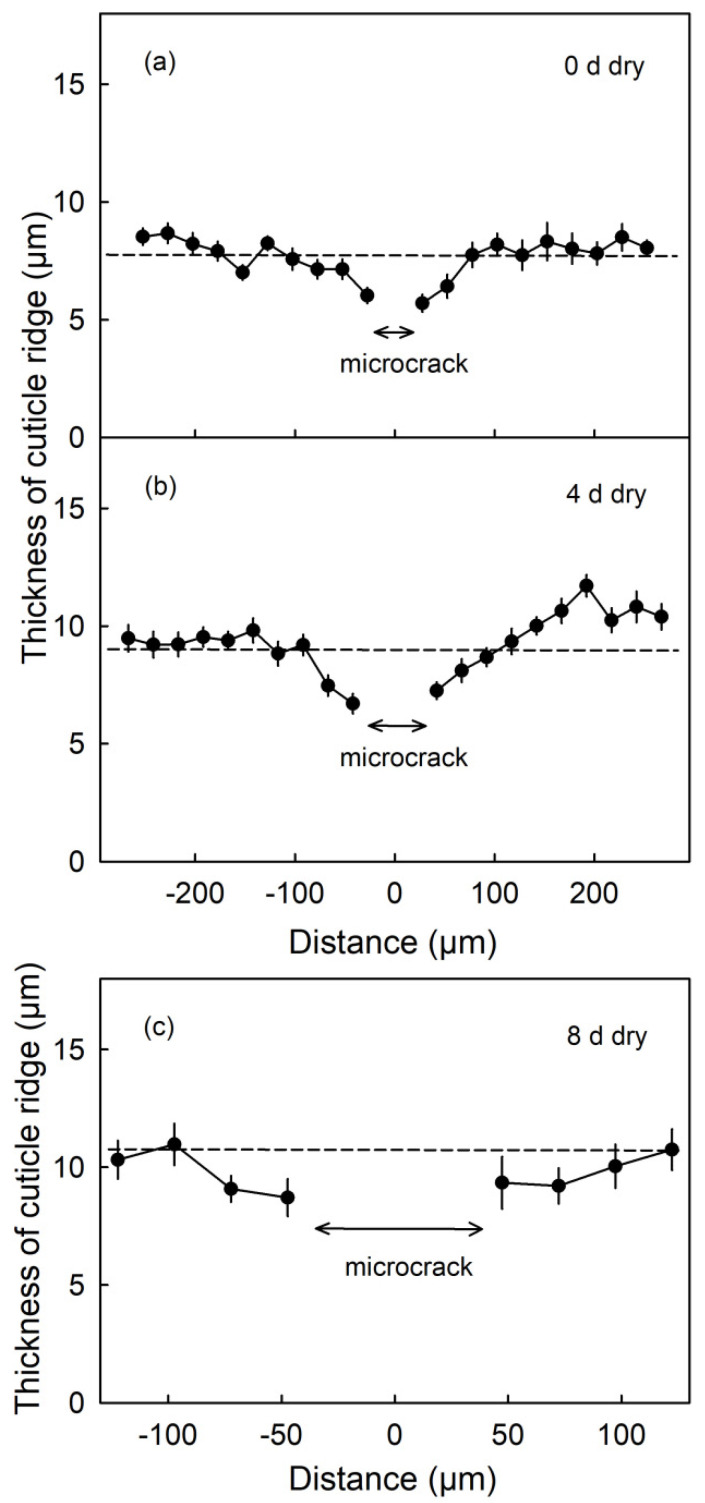
Figure 9.
Thickness of the cuticle above the anticlinal cell walls (ridge) as affected by the distance from a moisture induced microcrack. Microcracks were induced by 12 d of moisture exposure. Thickness was measured on cross-sections of the fruit skin prepared from fruit sampled on the day of termination of moisture exposure (0 d) (a) and 4 d (b) and 8 d (c) after moisture termination (during Phase II). The distance ‘0’ represents the center of the microcrack. Thickness was measured in both directions from the microcrack. The dashed line is the grand mean thickness of all cuticle ridges within the micrograph. The arrows indicate the mean width of the microcrack. Data represent means ± SE of 14 to 19 microcracks on a total of six fruits.

