Figure 1.
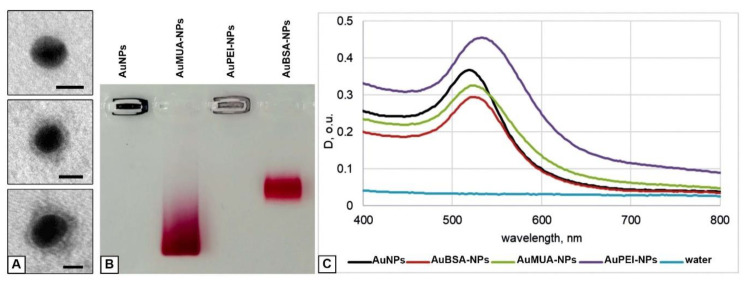
Physicochemical characterization of the NPs. (A) TEM images of AuNP (top), AuPEI-NP (middle) and AuBSA-NP (bottom). Negative staining with phosphotungstic acid. Bars correspond to 10 nm. (B) Image of the gel after electrophoretic analysis of AuNPs, AuMUA-NPs, AuPEI-NPs and AuBSA-NPs. (C) Optical extinction spectra of AuNPs, AuMUA-NPs, AuPEI-NPs and AuBSA-NPs in water. We used samples with different concentrations to separate the curve maximums for clear visualization.

