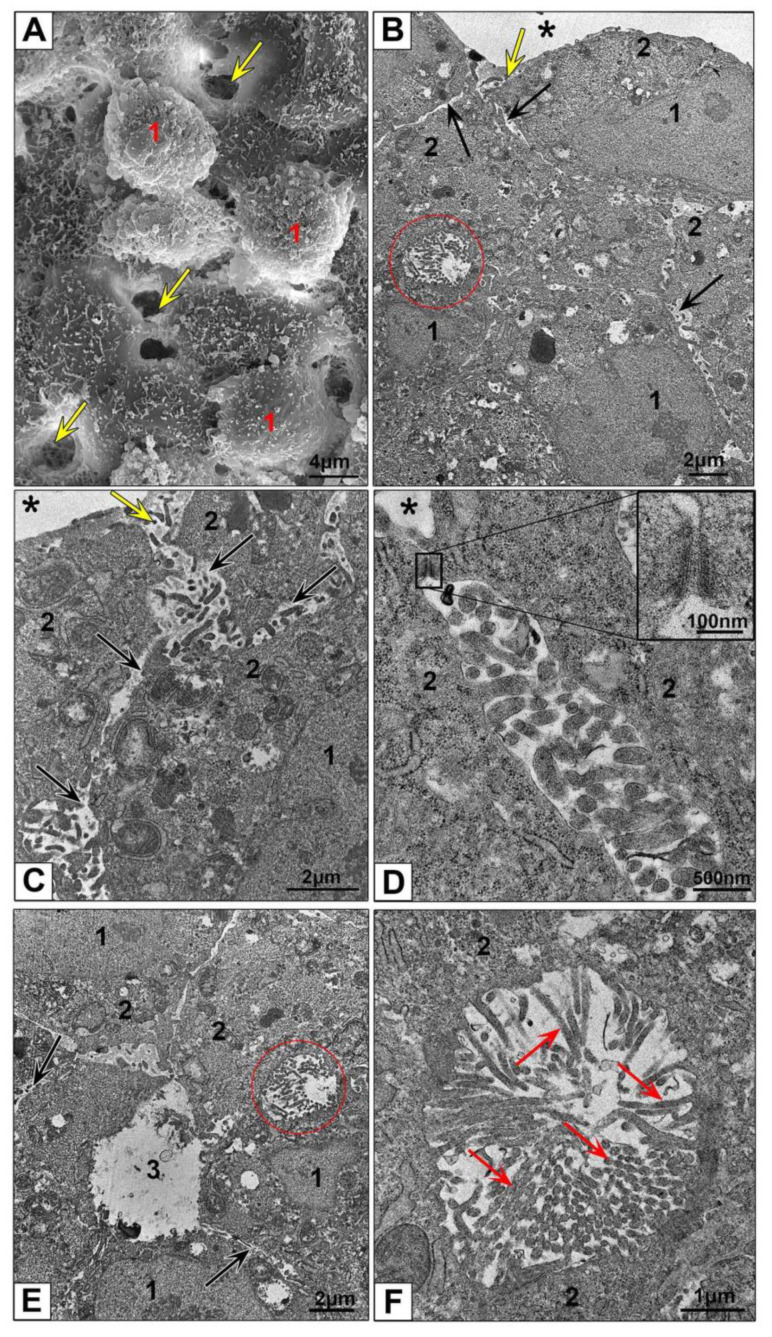
Figure 4.
Ultrastructure of HepG2 spheroids. (A) Representative SEM image of spheroid surface. 1—bulging cells; arrows show openings on spheroid surface; (B–D) HepG2 spheroid periphery; (E) area at a distance of 50 µm from the surface; (F) bile capillary with microvilli. 1—nucleus; 2—cytoplasm; 3—lumen of cross-sectioned psedosinusoid; asterisks show external space; ovals show bile capillaries; yellow arrows show a space between hepatocytes (openings in SEM); black arrows show a space between lateral surfaces of neighboring cells; red arrows show microvilli; a frame shows desmosome between cells, and insert shows this desmosome at high magnification. (B–F) Ultrathin sections, TEM.

