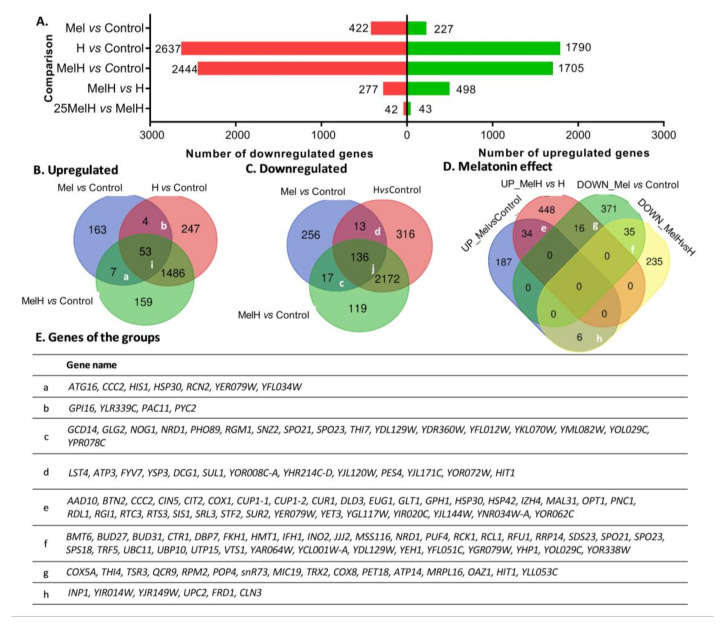
Figure 1.
Distribution of differentially expressed genes in yeast cells grown with and without melatonin (5 μM or 25 μM), in stressed (2 mM of H2O2) and in unstressed conditions (Control, Mel, MelH, 25MelH and H). (A) The number of differentially expressed genes between different conditions (fold change −1 ≤ FC ≥ 1; p-value < 0.05). (B,C) Venn diagram showing the number of common genes found among the Mel vs. Control, MelH vs. Control and H vs. Control comparisons (up- (B) and down (C) regulated genes). (D) Venn diagram showing the number of common genes found among the up- and downregulated genes identified in the Mel vs. Control and MelH vs. H comparisons. (E) List of genes in some groups indicated in (B–D). The list of genes and the GO enrichment analysis of all the groups is shown in Table S1.

