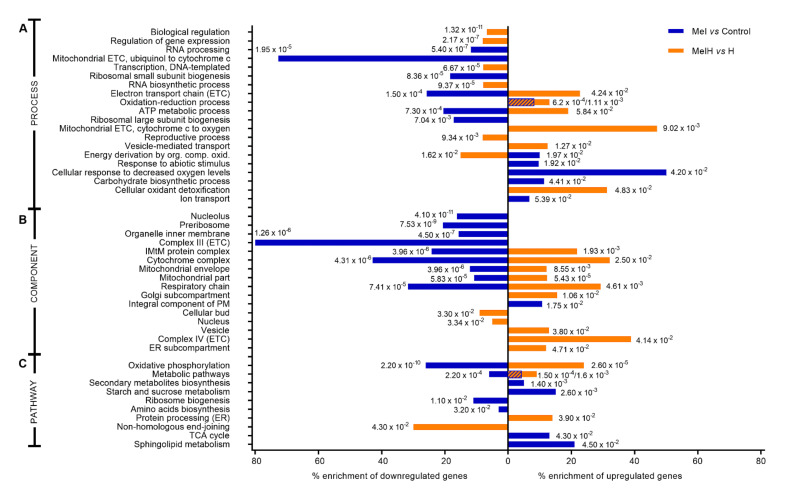
Figure 2.
Categories enriched by differentially expressed genes that were up- (values to the left) and down- (values to the right) regulated (1 ≤ fold change ≥1; p-value < 0.05) among nonstressed (blue) and stressed (orange) (2 mM H2O2) cells in the absence or presence of melatonin (5 μM). Percentages of enrichment are calculated as the ratio of the number of up- or downregulated genes in relation to the total number of genes involved in each molecular function or pathway in S. cerevisiae. The numbers correspond to the p-values. When two p-values are presented, the left one corresponds to Mel vs. Control and the right to MelH vs. H. (A) Biological process function enrichment from Gene Ontology (GO) analysis, (B) cellular components enriched according to GO analysis, (C) pathway enrichment analyzed with the DAVID tool. Abbreviations: ETC, electron transport chain; ER, endoplasmic reticulum; TCA, citrate cycle, IMtM, inner mitochondrial membrane.

