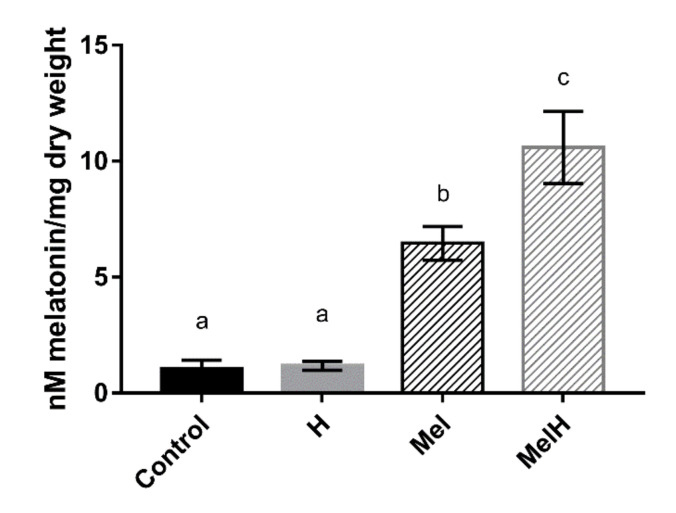
Figure 3.
Intracellular melatonin quantification in cells untreated and treated with 5 μM of exogenous melatonin, before (Control and Mel) and after (H and MelH) being exposed to oxidative stress with 2 mM of H2O2. Error bars represent standard deviation, letters show statistical differences with p-value < 0.05.

