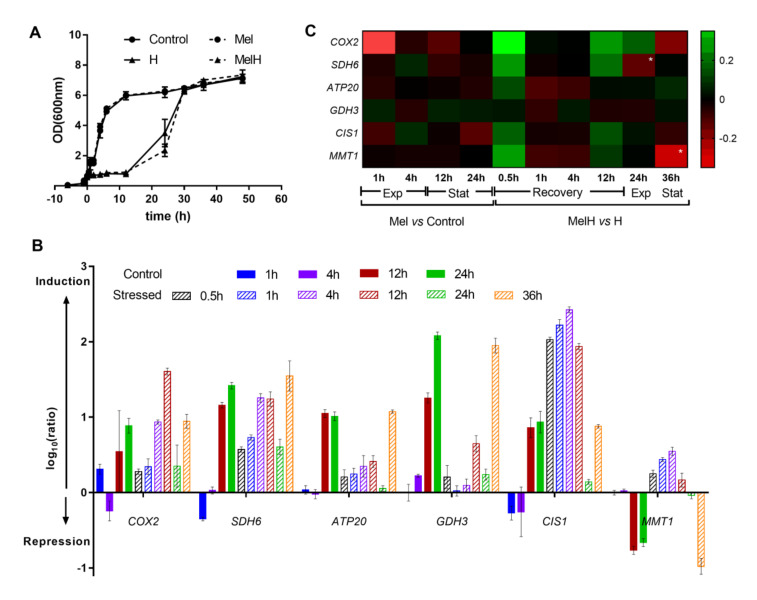
Figure 5.
Expression of six selected genes over a time course. (A) Kinetics of yeast growth according to OD600nm values. The cells were incubated with or without melatonin (5 µM) for 6 h, and two conditions (Mel, MelH) were subjected to 2 mM H2O2 treatment (0 h). (B) Expression of each gene of interest at different time points in the nonstressed and stressed conditions (Control, H), expressed as log10(ratio). The ratio represents the 2−ΔΔCt value corrected to the 2−ΔΔCt value of the Control at 0 h. (C) Heat map of the effect of melatonin on the expression of the six genes during the time course analysis in nonstressed and stressed cells. The color corresponds to the log10 of the ratio. The ratio represents the 2−ΔΔCt value for the condition with melatonin corrected to the 2−ΔΔCt value for the condition without melatonin. Genes are presented in rows, and the time points under both conditions are presented in columns. Exp, exponential phase; stat, stationary phase. High-intensity colors refer to values >0.35 (green) or < −0.35 (red) * significance level of < 0.05. Error bars represent the standard deviation, and the statistical analysis of B and C is presented in Table S3.

