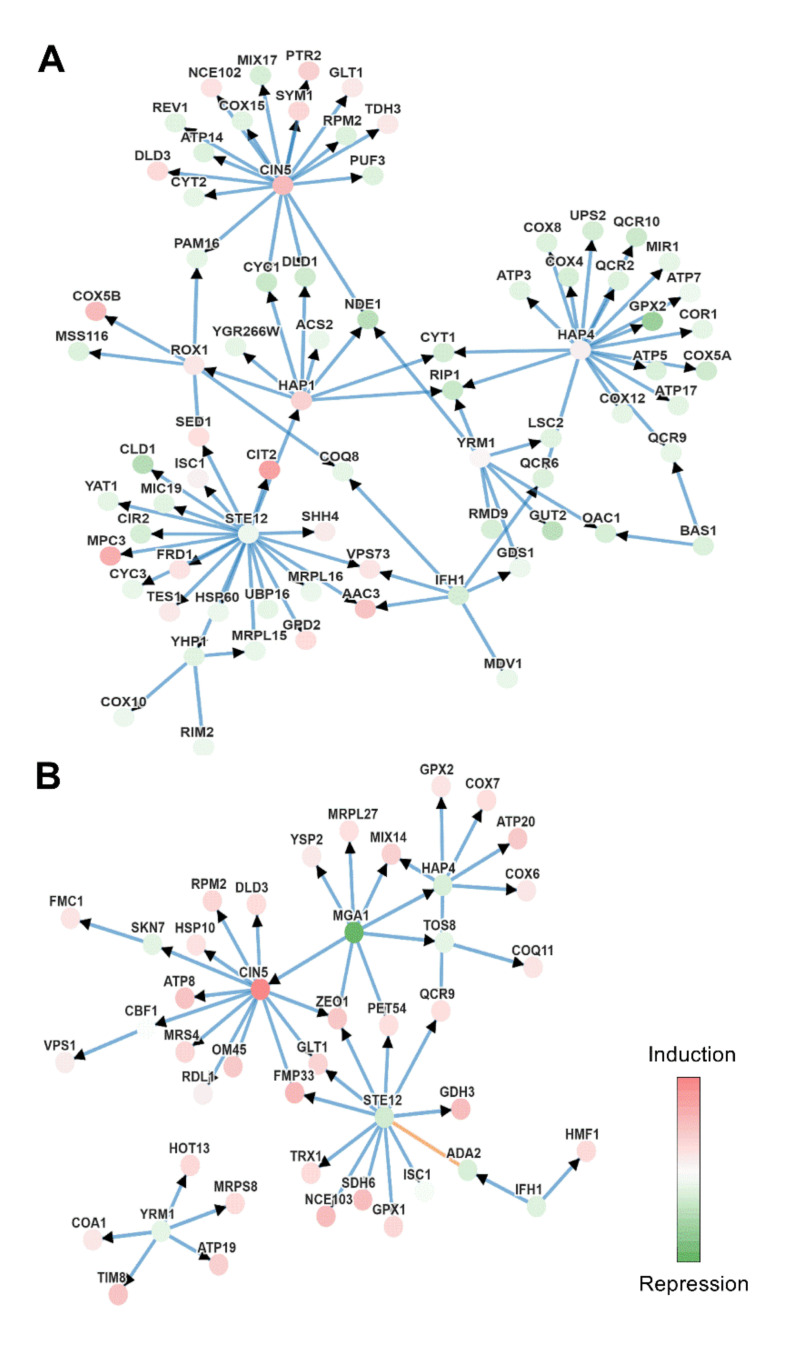
Figure 7.
Genetic interactions given by Phenetics using mitochondrial genes with −1 < FC < 1, p-value < 0.05. Set of genes used in each comparation: (A) Mel vs. Control. (B) MelH vs. H. Nodes represent molecular entities, and the intensity of its color represents the level of differential expression, green being under-expression and red over-expression. The edges indicate the interaction between the genes (blue indicates protein-DNA and orange protein-protein), and the arrows the direction of the interaction.

