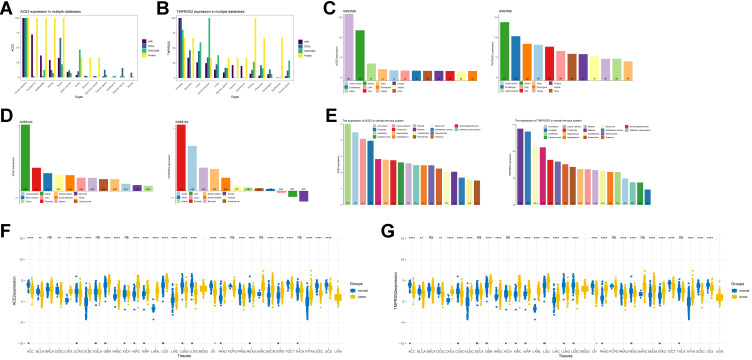
Figure 1.
The expression of ACE2 and TMPRSS2 in tissue.
Notes: (A) The mRNA and protein expression pattern of ACE2 in HPA, GTEx and FANTOM5. (B) The mRNA and protein expression pattern of TMPRSS2 in HPA, GTEx and FANTOM5. (C) The mRNA expression pattern of ACE2 and TMPRSS2 in GSE3526. (D) The mRNA expression pattern of ACE2 and TMPRSS2 in GSE8124. (E) The mRNA expression pattern of ACE2 and TMPRSS2 in central nervous system. (F) The mRNA expression pattern in TCGA, ** = P<0.01, **** = P<0.0001, ns = P>0.05. (G) The mRNA expression pattern of TMPRSS2 in TCGA, ** = P<0.01, **** = P<0.0001, ns = P>0.05.

