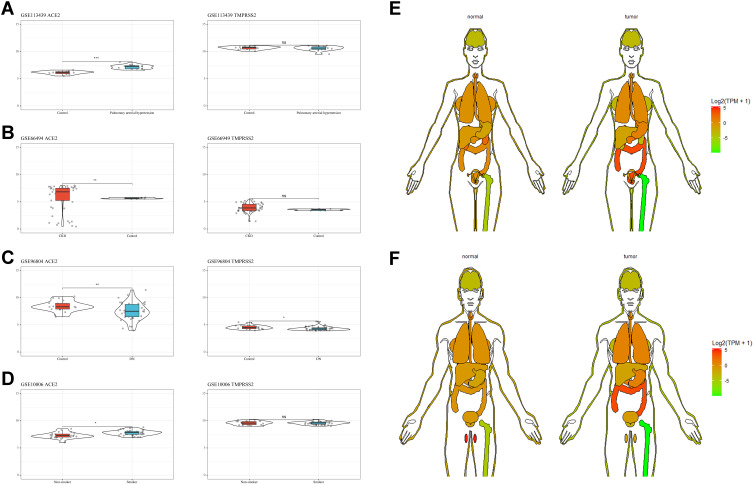
Figure 3.
ACE2 and TMPRSS2 expression patterns in specific patient populations.
Notes: (A) ACE2 and TMPRSS2 expression patterns in GSE113439, * = P<0.05, ** = P<0.01, *** = P<0.001, ns = P>0.05. (B) ACE2 and TMPRSS2 expression patterns in GSE66494, * = P<0.05, ** = P<0.01, *** = P<0.001, ns = P>0.05. (C) ACE2 and TMPRSS2 expression patterns in GSE96804, * = P<0.05, ** = P<0.01, *** = P<0.001, ns = P>0.05. (D) ACE2 and TMPRSS2 expression patterns in GSE10006, * = P<0.05, ** = P<0.01, *** = P<0.001, ns = P>0.05. (E) ACE2 and TMPRSS2 expression patterns in female. (F) ACE2 and TMPRSS2 expression patterns in male.

