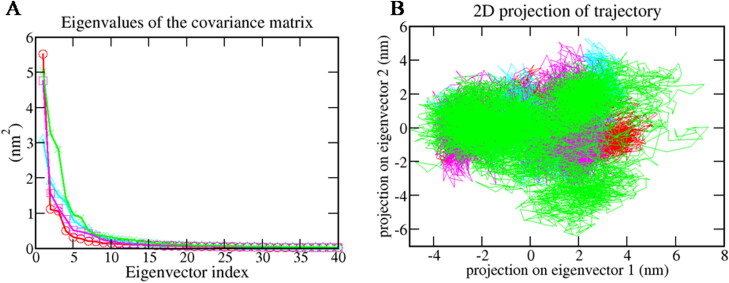
Figure 10.
Principal component analysis (A.) Plots of eigenvalues vs. first 40 eigenvectors. (B) First two eigenvector describing the protein motion in phase space for all the complexes. The color code for all panels is as follows protein-reference(X77) (Red), Mpro-Epsilon-vinifein (Cyan), Mpro-Peimisine (Magenta), and Mpro-Gmelanone (Green).

