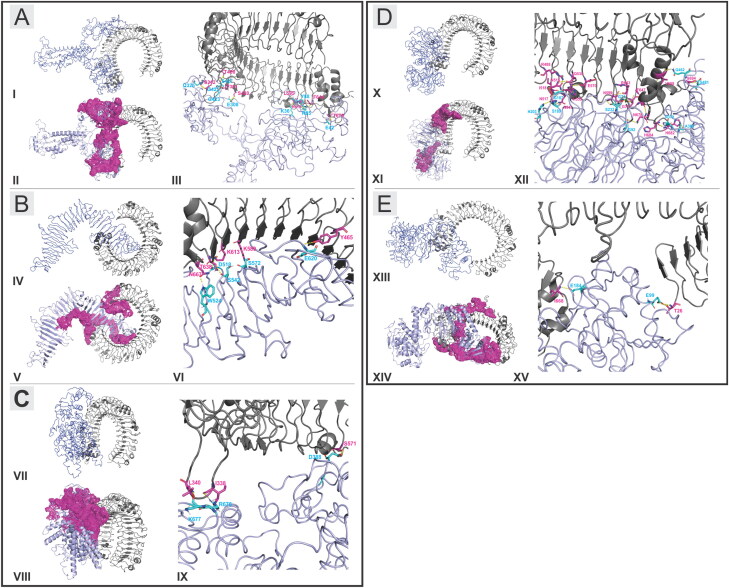
Figure 7.
Molecular docking study of CTL and HTL MPVs with TLR3-ECD complexes. (A, B, C, D, E): Complex formation by the MPVs (CTL-MPV-1, CTL-MPV-2, CTL-MPV-3, HTL-MPV-1, HTL-MPV-2) and TLR3-ECD, respectively. (A-I, B-IV, C-VII, D-X, E-XIII): B-factor analysis presentation for the docked MPVs to the TLR3-ECD. The presentation is in VIBGYOR color, with blue showing low B-factor and red show high B-factor. Here, most of the MPV regions are in blue showing low B-factor and hence suggesting a stable complex formation with TLR3-ECD. (A-II, B-V, C-VIII, D-XI, E-XIV): Binding site formed by the MPVs and TLR3-ECD at the molecular interaction interface, represented in magenta-binding patches. All the CTL and HTL MPVs have shown to form prominent and close binding site region with TLR3-ECD. (A-III, B-VI, C-IX, D-XII, E-XV): Representation of hydrogen bond formation is shown. The residues involved in hydrogen bond formation from MPVs are shown in cyan, and the residues from TLR3-ECD are shown in magenta. The hydrogen bonds are shown by yellow dots.

