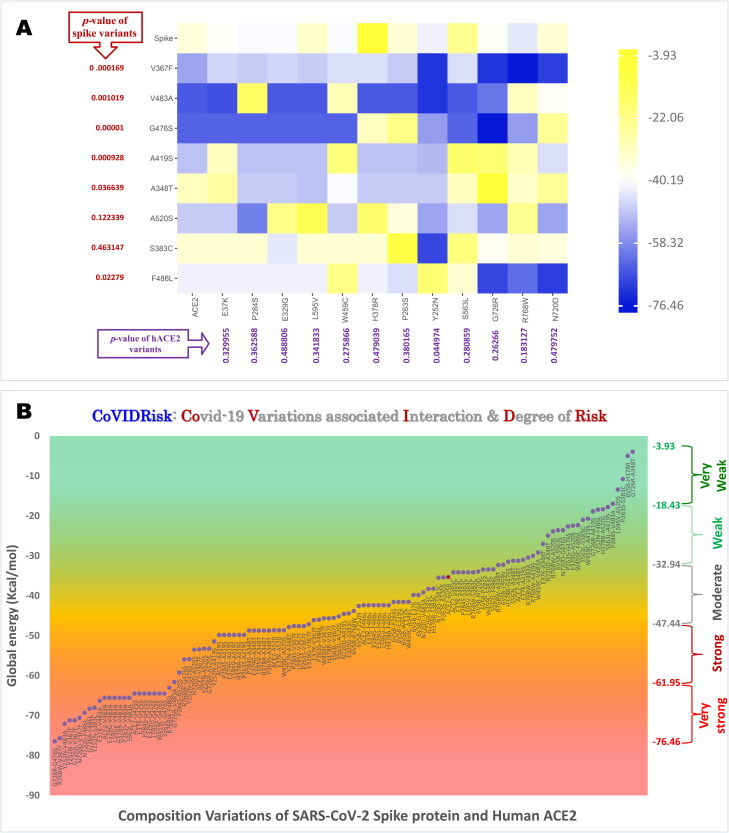
Figure 7.
A: Heat map of Global energy score for composition variations of hACE2 and SARS-CoV-2 spike protein-generated Heatmapper (http://www.heatmapper.ca/pairwise/) with matrix of Displaying data as-is. and their significant impact; B: graphical representations of all composition variations that reflect the degree of binding to SARS-CoV-2.

