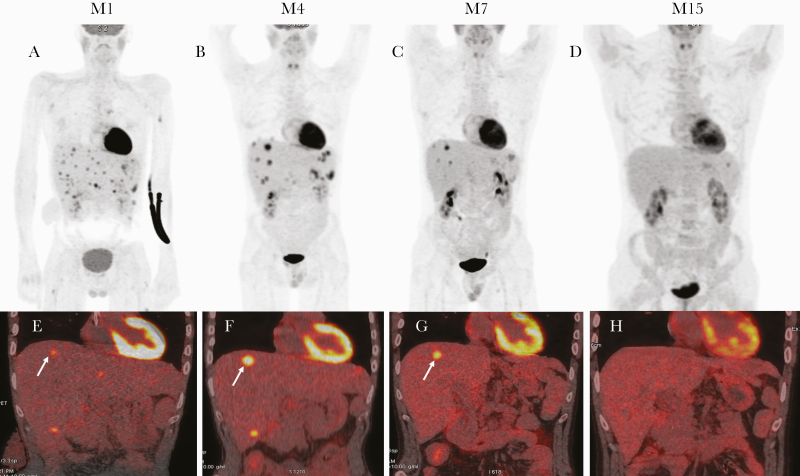
Figure 1.
18-FDG positron emission tomography/computed tomography (PET/CT) during disease course. 18-FDG PET/CT scan maximum intensity projection (MIP) showed a metabolic modification with progression of several liver nodules despite the regression in numbers between month 1 (M1) (A) and month 4 (M4) (B), then decreased FDG uptake in the liver abscess and regression in uptake of numbers of lesions at month 7 (M7) (C) and complete regression at month 15 (M15) (D). Fused coronal PET and CT images show several abscesses with a target on the liver dome. In (E) (M1), the arrow indicates a liver node (SUV max, 6; metabolic tumor volume, 2.3 cm3). In (F), the arrow indicates an increase in FDG uptake in liver target (SUV max, 11.6; metabolic tumor volume, 4.5 cm3) at M4. G, Decreased metabolic activity (SUV max, 9.8; metabolic tumor volume, 2.5 cm3) at M7. H, No metabolic activity at M15.

