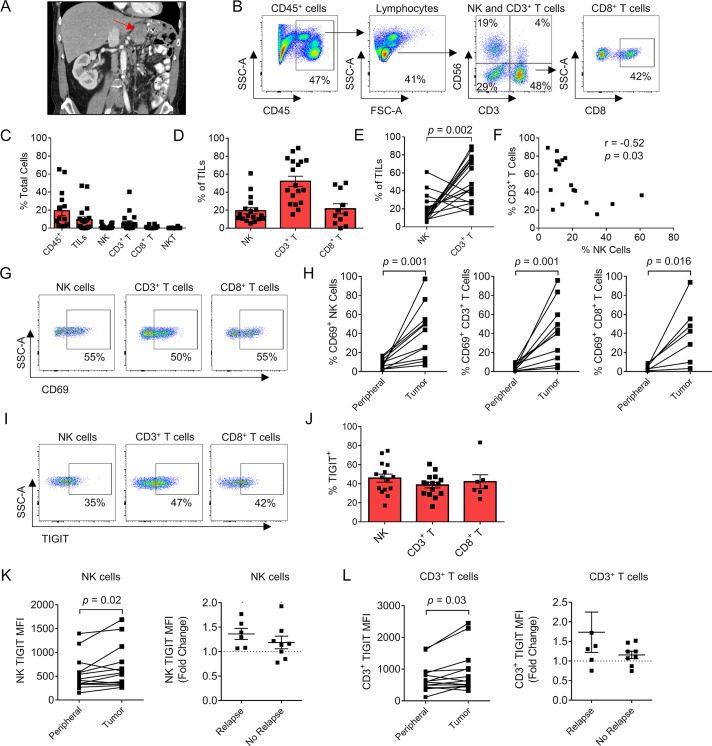
Figure 3.
Sarcoma-infiltrating NK and T cells show phenotypic evidence of both increased activation and exhaustion, including TIGIT. (A) Preoperative CT imaging of a retroperitoneal dedifferentiated liposarcoma. (B) Representative flow cytometry gating showing CD45+ cells, lymphocytes, NK, CD3+ T cells, NKT cells, and CD8+ T cells. (C) Composition of the immune infiltrate as a per cent of total cells. (D) Proportion of NK, CD3+ T, and CD8+ T cells as a per cent of the TIL population. (E) Paired analysis per tumor of per cent NK cells and CD3+ T cells with significantly greater T cell infiltration present. (F) Strong negative correlation between per cent NK cells and per cent CD3+ T cells within the TIL population (r=−0.52, p=0.03). (G) Representative flow cytometry gating showing expression of activation marker CD69 in the TIL population. (H) Paired analysis per patient of CD69 expression between the periphery and tumor in NK, CD3+ T, and CD8+ T cells. (I) Representative flow cytometry gating showing expression of TIGIT in the TIL population. (J) Distribution of TIGIT expression in TIL subsets. Paired analysis of TIGIT MFI on peripheral and tumorous (K) NK cells and (L) CD3+ T cells showing overall increased expression within the tumor and fold change in patients with TIGIT MFI who relapsed compared with those who did not. Mean±SEM. P values determined using Wilcoxon test. correlations determined by two-tailed Spearman coefficient. MFI, median fluorescence intensity; NK, natural killer; TIL, tumor-infiltrating lymphocyte.

