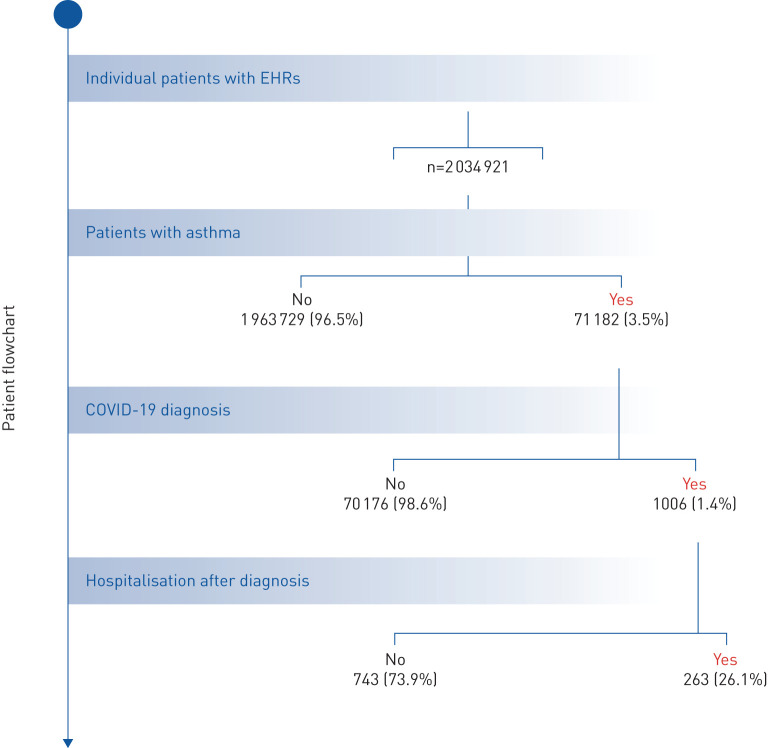
FIGURE 1.
Flowchart depicting the total number of patients with available electronic health records (EHRs), the number of patients with asthma, the number of patients diagnosed with coronavirus disease 2019 (COVID-19), and of those, the number of hospitalisations after diagnosis during the study period (January 1 to May 10, 2020). All percentage values are computed in relation to the level immediately above.

