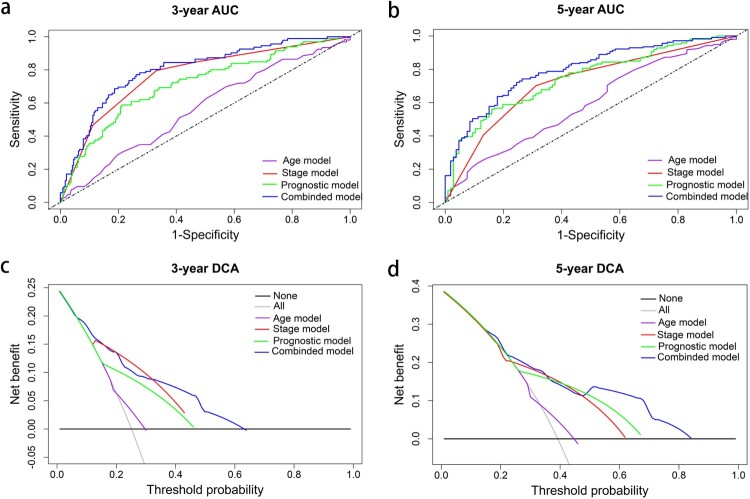
Figure 7.
The time-dependent ROC and DCA curves of the nomogram. (a, b) The time-dependent ROC curves of the nomogram compared with other independent prognostic factors for the 3- and 5-year overall survival of patients with KIRC. (c, d) The DCA curves of the nomograms compared with other independent prognostic factors of the 3- and 5-year overall survival of patients with KIRC.

