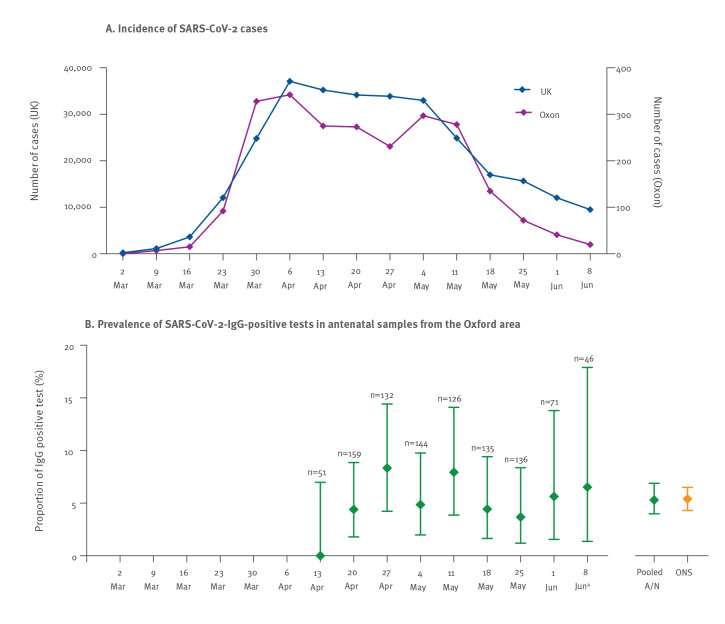
Figure 1.
(A) Incidence of SARS-CoV-2 cases in Oxfordshire and the United Kingdom during the first peak of the COVID-19 pandemic, shown in parallel with (B) prevalence of SARS-CoV-2-IgG-positive antenatal samples from the Oxford area, presented by week, March–June 2020
A/N: antenatal; COVID-19: coronavirus disease; ONS: Office of National Statistics data; Oxon: Oxfordshire; SARS-CoV-2: severe acute respiratory syndrome coronavirus 2.
(A) Incidence of SARS-CoV-2 cases, based on nose/throat swab reverse-transcription PCR testing; purple line shows diagnosed cases in Oxfordshire; blue line shows diagnosed cases in England (data from public sources [22,23]). (B) SARS-CoV-2 IgG prevalence in antenatal serum samples is shown in green, from the week commencing 13 April (bars show 95% confidence intervals; number at the top of each bar indicates number sampled during this week). Final two bars show pooled data for the Oxford area A/N sample collection (green), compared with data for South-East England collected by the ONS, for which SARS-CoV-2 IgG prevalence is shown for the period 26 April–8 June, measured using the same ELISA (orange) [1].
a Data for the last 2 weeks of our serosurvey are pooled due to small numbers tested in the final week, where testing was only conducted on 1 day (15 June).

