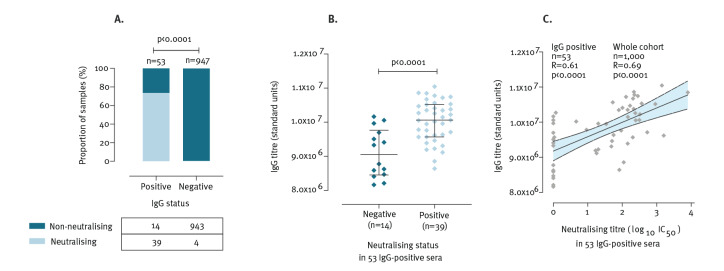
Figure 3.
Relationship between SARS-CoV-2 IgG (standard units by ELISA) and neutralisation (based on pseudovirus microneutralisation assay) in serum samples from antenatal women in the Oxford area, United Kingdom, (n = 1,000 women tested)
CI: confidence interval; ELISA: enzyme-linked immunosorbent assay; IC50: half maximal inhibitory concentration; SARS-CoV-2: severe acute respiratory syndrome coronavirus 2.
(A) Concordance between IgG status (i.e. negative or positive; threshold for positivity set at 8.0×10⁶ standard units) and neutralising activity of serum samples (n = 1,000); p-value by Fisher’s Exact Test; (B) IgG titres in samples meeting the threshold for IgG-positivity (n = 53), grouped according to neutralisation status; lines indicate median and interquartile range; p-value by Mann–Whitney U test. Four IgG-negative samples in which neutralising activity was detected are shown in Figure S3; (C) Relationship between quantitative ELISA read-out and neutralisation expressed as log10 IC50 in IgG-positive samples (n = 53). Shaded area shows 95% CI. R and p-value by Pearson’s correlation are presented both the 53 datapoints shown, and for the whole sample set of 1,000 sera (among which those with no measurable neutralising activity were assigned as zero).

