
Figure 3.
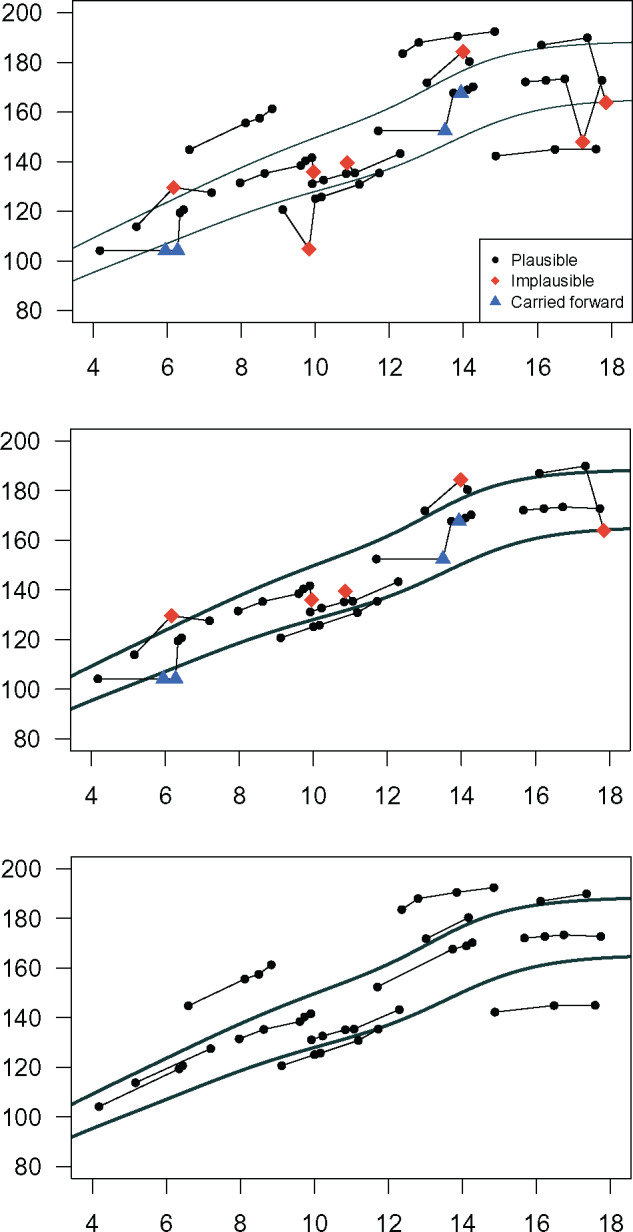
Eleven individual male height trajectories were selected as exemplars and plotted against Centers for Disease Control 5th and 95th percentiles (A) without cleaning, (B) cleaned by removing weight values with |SD|>3, and (C) cleaned using the automated method. The legend indicates status of individual values as determined by the automated method.