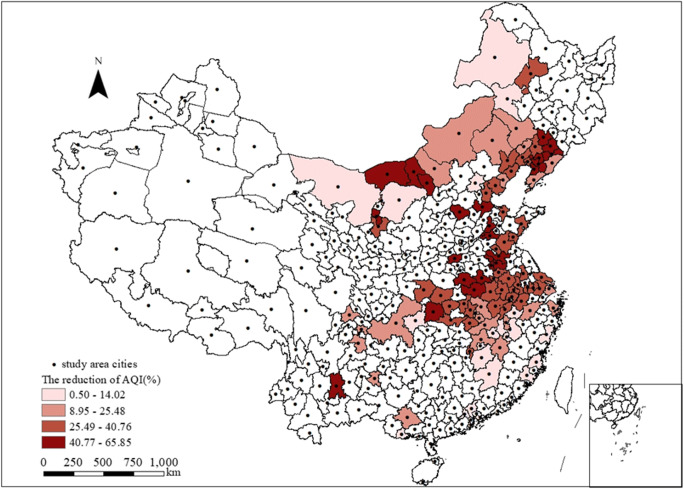
Fig 2.
The reduction of AQI before and after lockdowns. This figure reflects the geographic distributions of cities involved in this study and the relative change in the average value of AQI after lockdown compared with that before lockdown in treated cities during the sample period. The non-white area indicates cities that enforce lockdown policies

