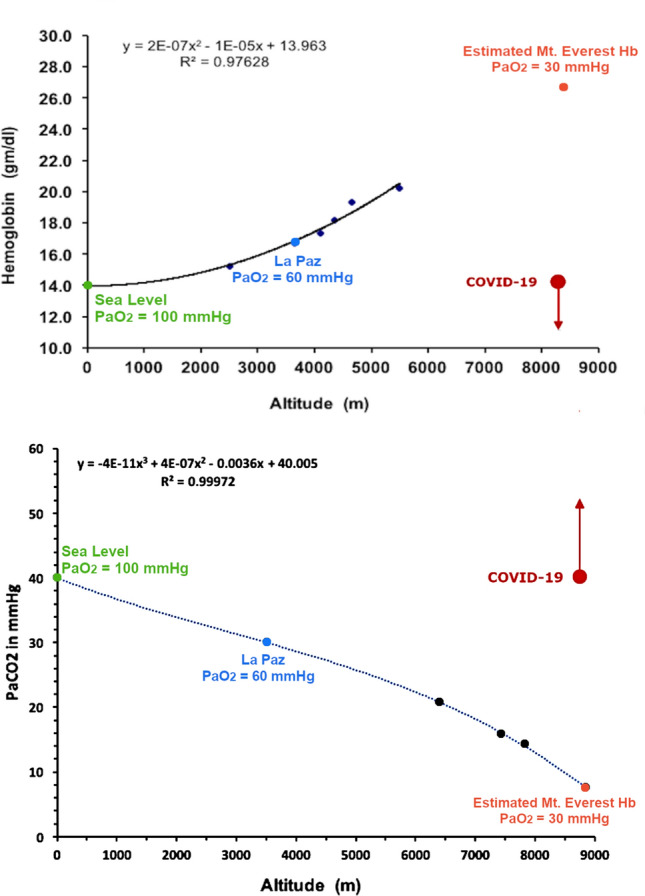
Fig. 3.

Tolerance to Hypoxia = (Hb/PaCO2) × 3.01. Shown here are the two variables and the probable COVID-19 behavior. A) Hemoglobin-Altitude, B) PaCO2-Altitude. Red arrows: acute hypoxia in COVID-19 pneumolysis, at sea level, simulating Mt. Everest extreme hypoxia, with hemoglobin and PaCO2 values progressing oppositely to expected optimal life-sustaining physiology under chronic hypoxic conditions
