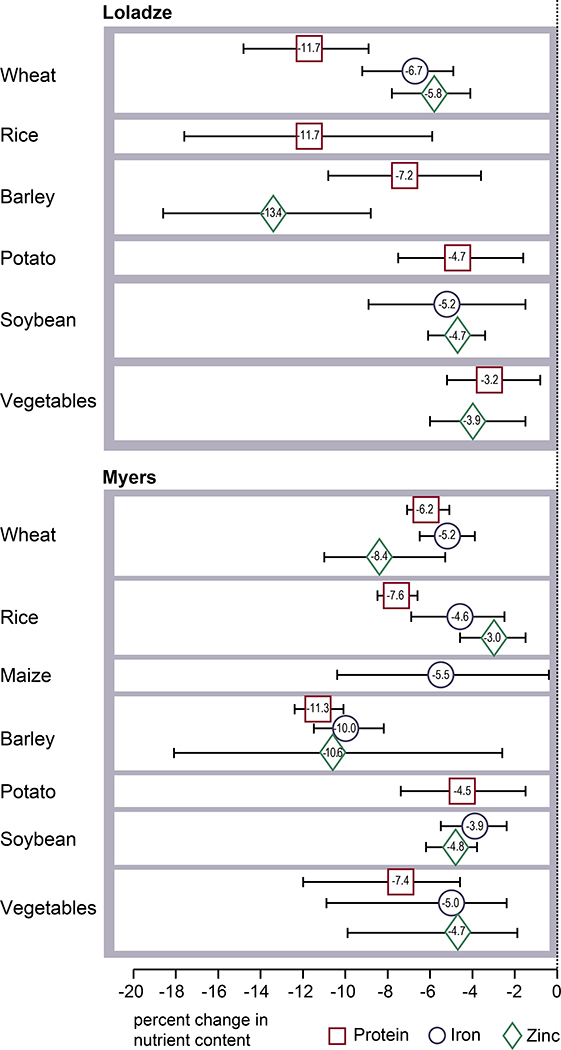
Figure 1: Carbon nutrient penalties.
Percentage change in protein, iron, and zinc from increased atmospheric CO2 concentration (541 ppm) across seven groups of crop types available in Loladze18 and Myers et al19 datasets. Whiskers represent 95% CIs. Aggregate crop carbon nutrient penalties applied to commodities in the IMPACT model not shown in these datasets are in the appendix (pp 4–8). Where an observed carbon nutrient penalty is missing, data were either not available or did not meet inclusion criteria. IMPACT=International Model for Policy Analysis of Agricultural Commodities and Trade.

