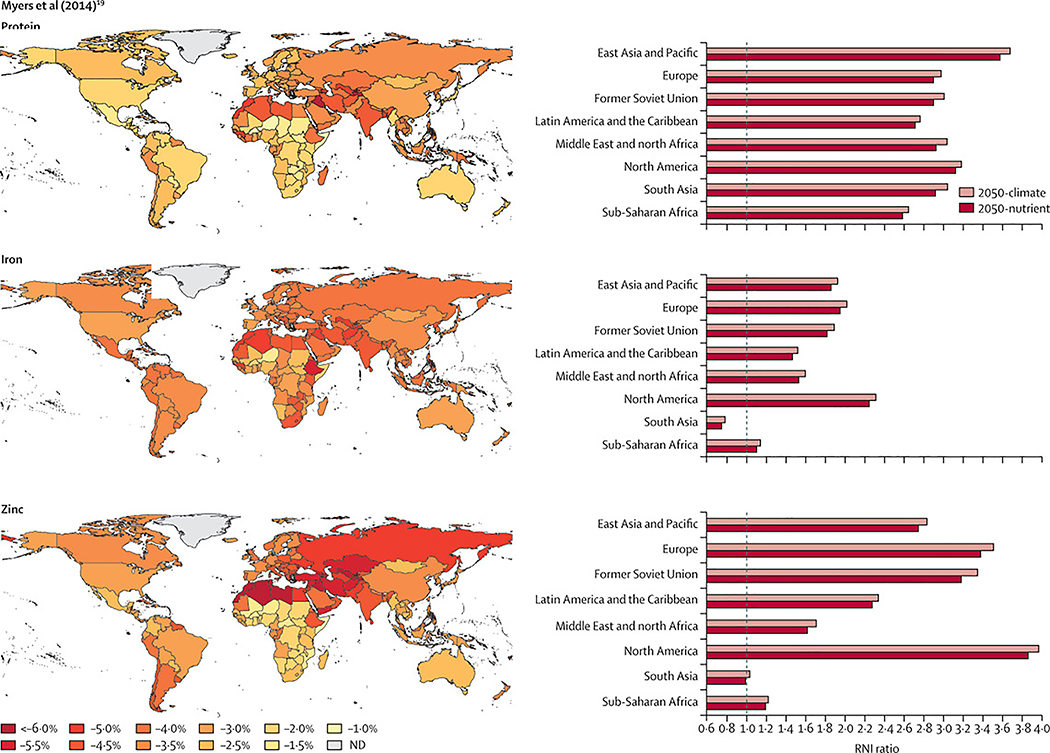
Figure 3: Net effects of increasing atmospheric CO2 and climate change on nutrient availability in 2050 using Myers et al (2014)19 dataset.
Maps show percentage change in 2050 per capita nutrient availability of protein, iron, and zinc for the 2050-nutrient scenario compared with the 2050-climate scenario. Graphs show the change in RNI ratio in 2050 from the 2050-climate scenario to the 2050-nutrient scenario by region. The dotted vertical line indicates a 1:1 ratio of nutrients available to nutrients recommended (in mg per person per day for iron and zinc and g per person per day for protein). Results reflect the five global climate model average for the RCP8·5 scenario with CO2 fertilisation using the Myers et al (2014) dataset for carbon nutrient penalties. CO2=carbon dioxide. RNI=recommended nutrient intake. RCP=Representative Concentration Pathway. ND=no data.

