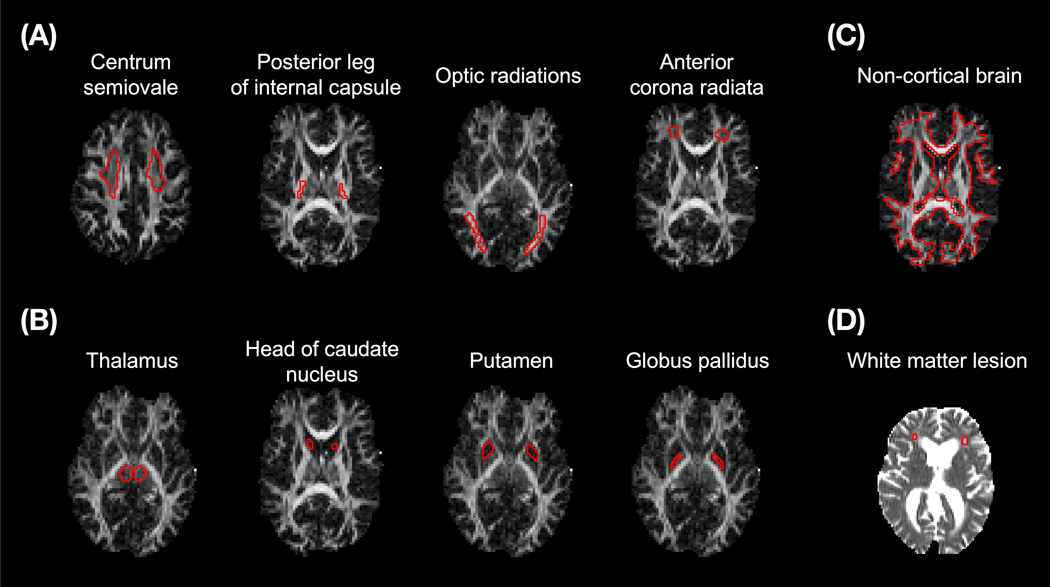
Figure 1 –
Regions of interest (ROIs) are shown in red for one adult volunteer (A–C) on top of an FA map and for one elderly subject (D) on top of an MD map. The ROIs were defined on maps obtained from a DTI analysis of data from shell 1 and 2 of the in vivo protocol (II in Table 2). Non-cortical brain tissue (C) was defined by manually including deep gray matter and the brainstem within a white matter mask generated by thresholding the μFA parameter from a QTI analysis (36).

