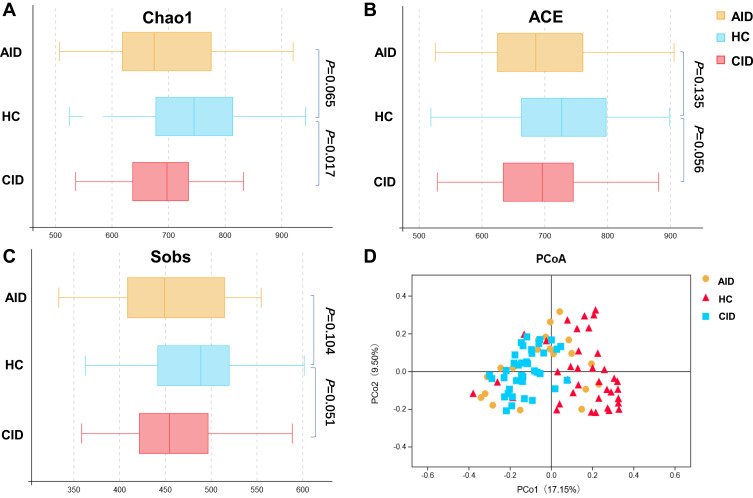
Figure 1.
Phylogenetic diversity of gut microbiomes among AID, CID, and HC groups.
Notes: Comparison of the Chao (A), ACE (B), and sobs (C) index between different groups (CID vs HC: P=0.017, P=0.056, and P=0.051, respectively; AID vs HC: P=0.065, P=0.135, and P=0.104, respectively; Wilcoxon rank-sum test). (D) PCoA of Bray-Curtis dissimilarity analysis demonstrated that the overall fecal microbiome composition of AID and CID clustered each separately from HCs, and the microbiome composition was also different between AID and CID (AID vs CID vs HC: P<0.001).

