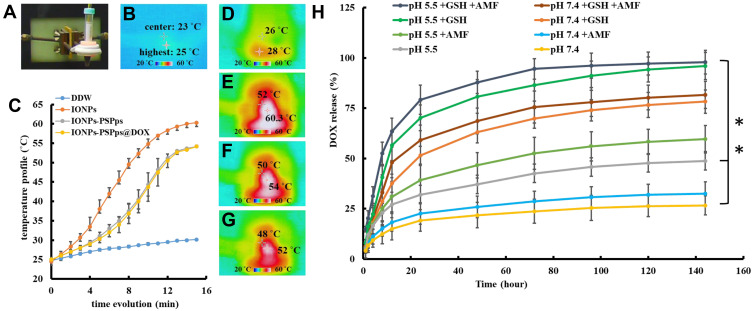
Figure 4.
Thermal behaviors and doxorubicin (DOX) release profiles of test samples. (A) A photograph of the setup for obtaining thermal images of test samples after exposure to an alternating magnetic field (AMF). Temperatures were recorded using a digital near-infrared thermal imaging camera. (B) Recorded thermal image before applying AMF, as the control group. (C) Increases in temperatures of test samples exposed to AMF versus time. Representative thermal images of test samples exposed to AMF: (D) double-distilled (DD) water, (E) IONPs, (F) IONPs-PSPps NPs, and (G) IONPs-PSPps@DOX NPs. The iron concentration of IONPs, IONPs-PSPps NPs, and IONPs-PSPps@DOX NPs was controlled at 200 μg⋅mL−1. The AMF power was set at 10 kW for 15 min. (H) Drug release profiles of IONPs-PSPps@DOX NPs dispersed in PBS at pH 5.5 or 7.4 in the presence or absence of 5 mM glutathione (GSH) at 37 °C, and with or without exposure to AMF at 10 kW for 15 min, respectively. Experiments were performed in triplicate (n=3, **p<0.01).

