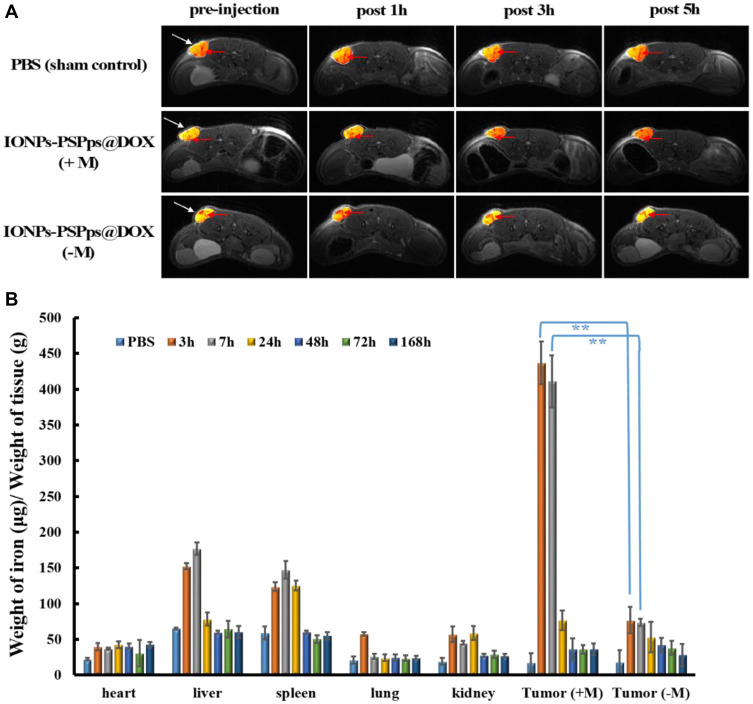
Figure 6.
In vivo magnetic resonance imaging and biodistribution. (A) In vivo T2-weighted images of PBS (control group) and IONPs-PSPps@DOX NPs at a dose of 10 mg.kg−1 using a 9.4-T animal magnetic resonance imaging (MRI) system. Mice were injected with IONPs-PSPps@DOX NPs intravenously, and MRI images were captured at preinjection and 1, 3, and 5h post-injection with magnet assistance or without magnet assistance for 30 min (tumor was indicated by white arrows; blood vessel was indicated by red arrows). (B) The residual iron contents in different tissues of A549 tumor-bearing mice. Mice were injected with IONPs-PSPps@DOX NPs in PBS via the tail vein at a dose of 24 mg⋅kg−1. In some groups, a magnet was placed near one of the tumors for 30 min (+M). (-M) indicates the tumor without the magnetic assistance. Three mice were sacrificed at the indicated time points, and the tissues were dissected for iron content measurements by inductively coupled plasma/atomic emission spectroscopy. The mice administered with PBS were used as a control group, and statistical analysis was performed using the two-tailed Student’s t-test (n=3, **p<0.01).

