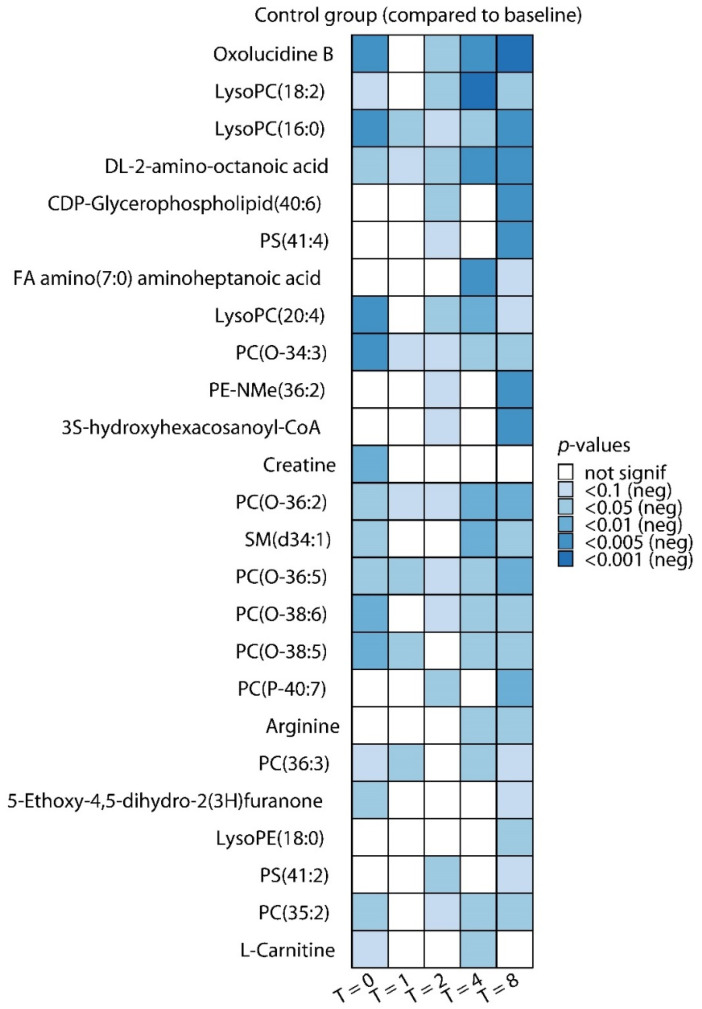
Figure 2.
Top differentially regulated metabolites during endotoxemia. Top 25 most significantly (according to p-value) regulated metabolites at T = 0 (just before LPS administration), 1, 2, 4, and 8 h post-LPS administration compared with baseline (one hour before LPS administration) in the control group. Blue color indicates a decrease compared with baseline (this top 25 only comprises decreased metabolites). p-values were calculated using paired t-tests with multiple-testing correction (Benjamini–Hochberg false discovery rate [FDR]).

