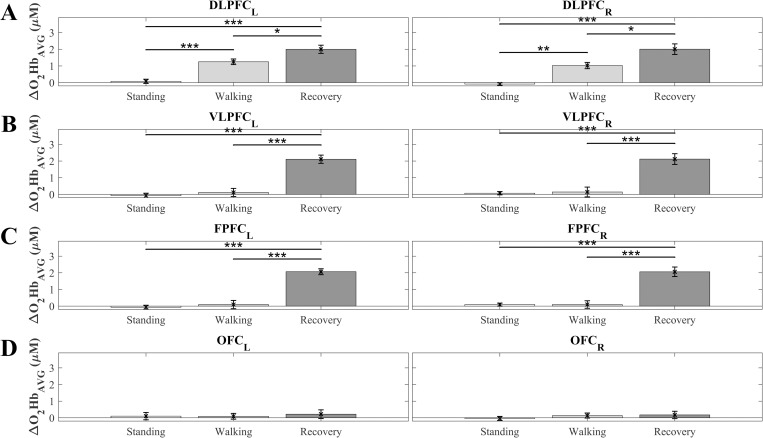
Fig 5. Oxyhemoglobin concentrations (ΔO2HbAVG) for the first slip trial.
Average values across all participants (N = 10) for left and right prefrontal cortex (PFC) subregions (top to bottom panels) as a function of the period (standing, walking, recovery): A) Left and right dorsolateral PFC (DLPFCL/R); B) Left and right ventrolateral PFC (VLPFCL/R); C) Left and right frontopolar FPFC (FPFCL/R); D) Left and right orbitofrontal cortex (OFCL/R). Error bars indicate standard error of the corresponding means. Asterisks: significant differences (* p < 0.05, ** p < 0.01, *** p < 0.0001).

