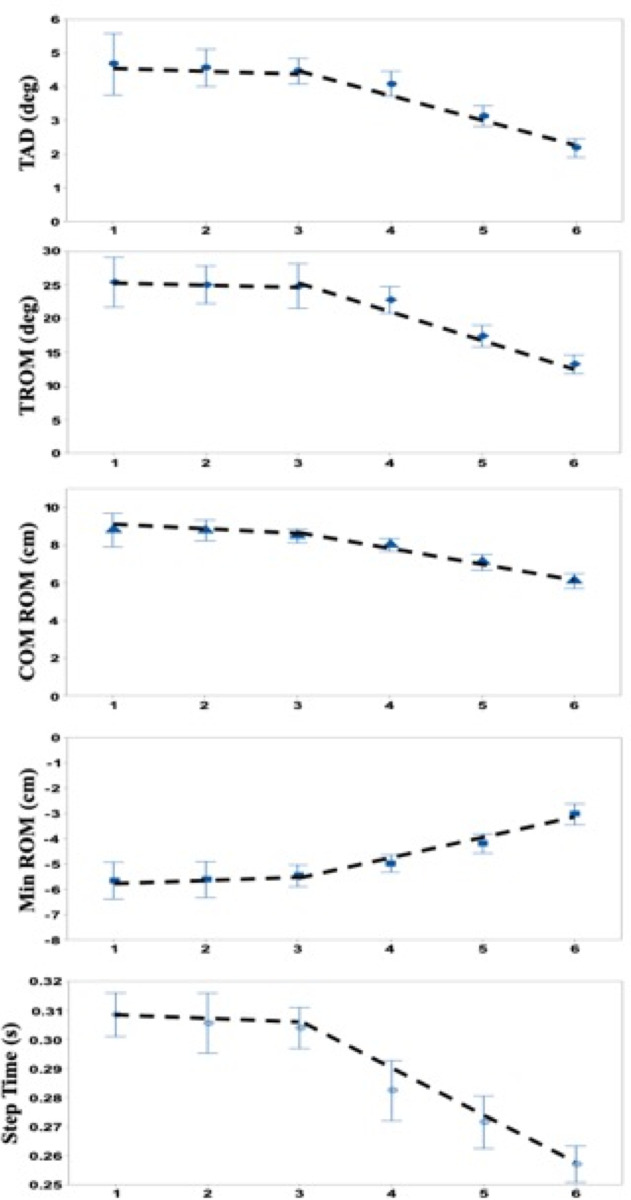
Fig 8. Kinematic variations and response time as a function of trials.
Average values across all participants (N = 10). From top to bottom: TAD = Trunk angular dispersion; TROM = Trunk range of motion; COM ROM = Center of mass range of motion; Min ROM = Minimum of COM; Step Time = first response step time. Error bars correspond to the standard error of the corresponding means. Piecewise linear regressions (---) use trial 3 as the break point (see Fig 5 and text for justification).

