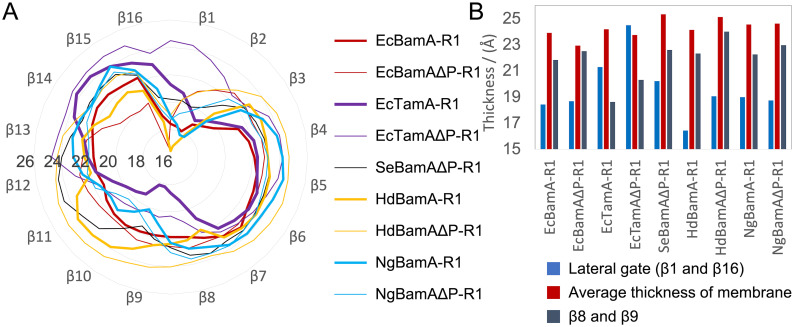
Fig 2. Membrane thickness in equilibrium simulations.
(A) Average thickness around the β-barrel for the first run of each system (See S6 Fig for all systems). Labeled concentric circles represent the membrane thickness in Å. (B) Average thickness of the whole membrane (in red) as well as average thickness near β8 and β9 at the back of the β-barrel in grey and near the lateral gate in blue.

