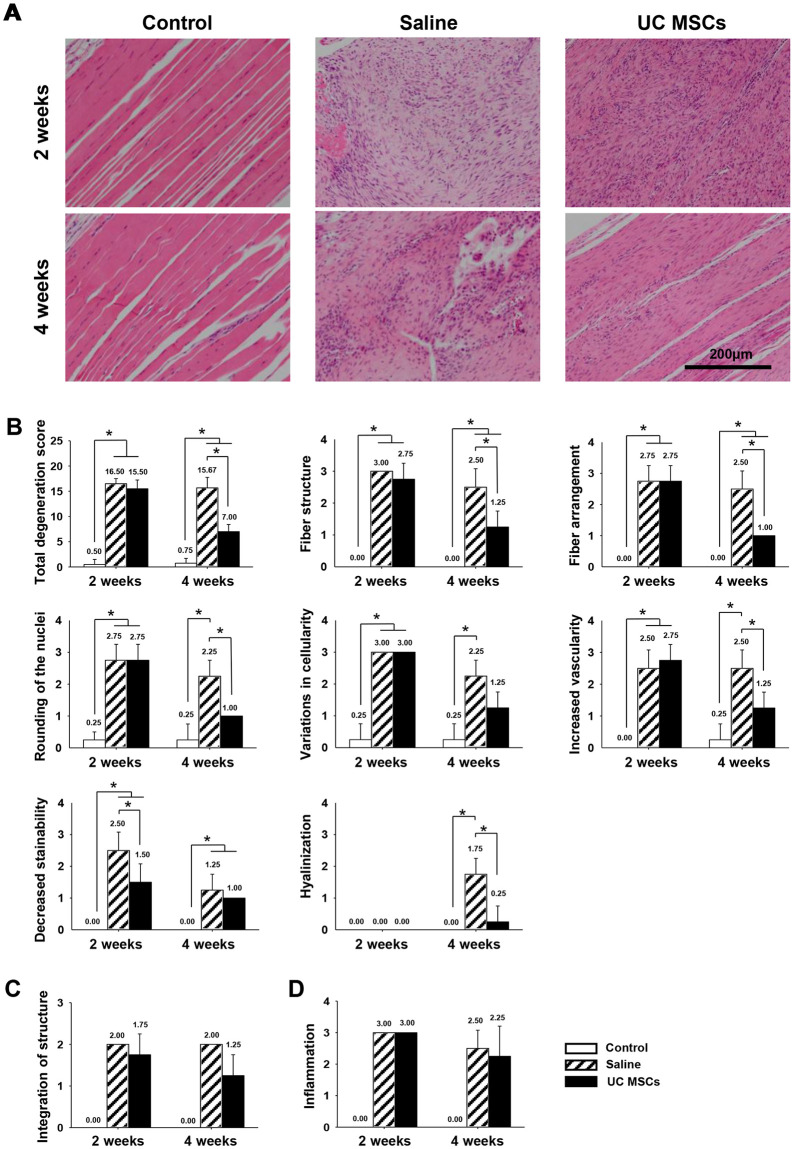
Fig 2. Representative histological images of general structure and quantification of the changes in regenerated tendon at two and four weeks.
(A): H&E staining of tendon (magnification; X200). (B): the total degeneration score and detail parameters. (C): Integration of structure between the tendon defect and adjacent tendon. (D): Inflammation at the tendon defect. Bar charts present mean ± standard deviation; statistically significant at p < .05. Abbreviations: UC MSCs, umbilical cord derived mesenchymal; H&E, hematoxylin and eosin.

