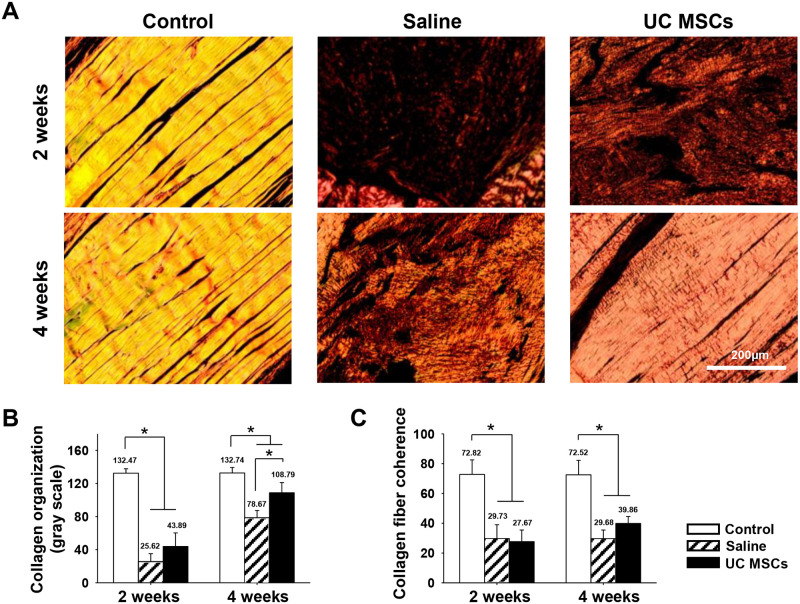
Fig 3. Representative histologic images of collagen matrix and quantification of the changes in regenerated tendon at two and four weeks.
(A): PSR staining of the tendon (magnification; X200). (B): collagen organization of the tendon. (C): collagen fiber coherency of the tendon. Bar charts present mean ± standard deviation; statistically significant at p < .05. Abbreviations: UC MSCs, umbilical cord derived mesenchymal; PSR, picrosirius red.

