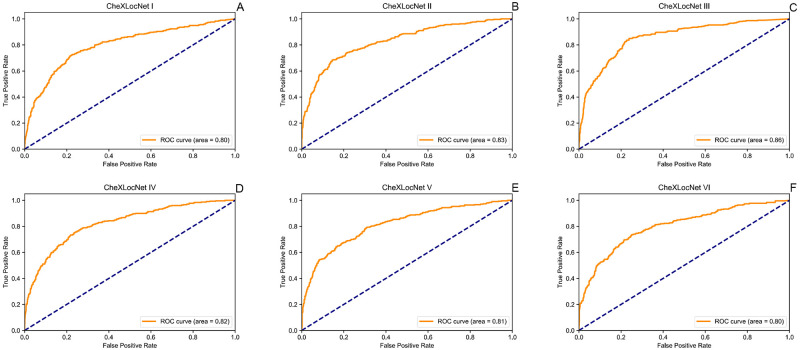
Fig 3. ROC curves of CheXLocNets on validation set.
Each plot illustrates the ROC curves of CheXLocNets on the validation set. The ROC curve of the algorithm is generated by varying the discrimination threshold (used to convert the output probabilities to binary predictions). ROC, receiver operating characteristic.

