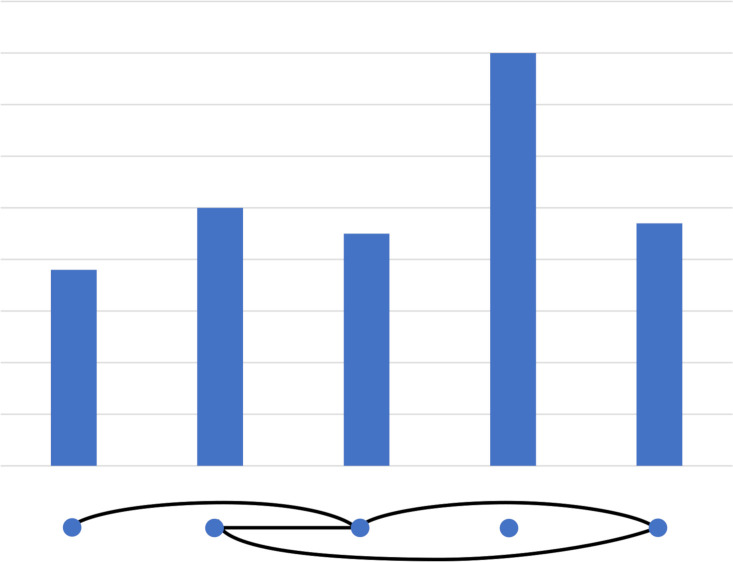
Fig 2. This is an example of a k = 2 time series (five poles) converted to a graph (five dots, below, with edges as solid lines).
This also illustrates the concepts of components (two components; the first consist of 1,2,3 and 5, the second of 4), bridges (one bridge, the edge between 1 and 3) and cliques (one 3-clique: 2,3 and 5).

