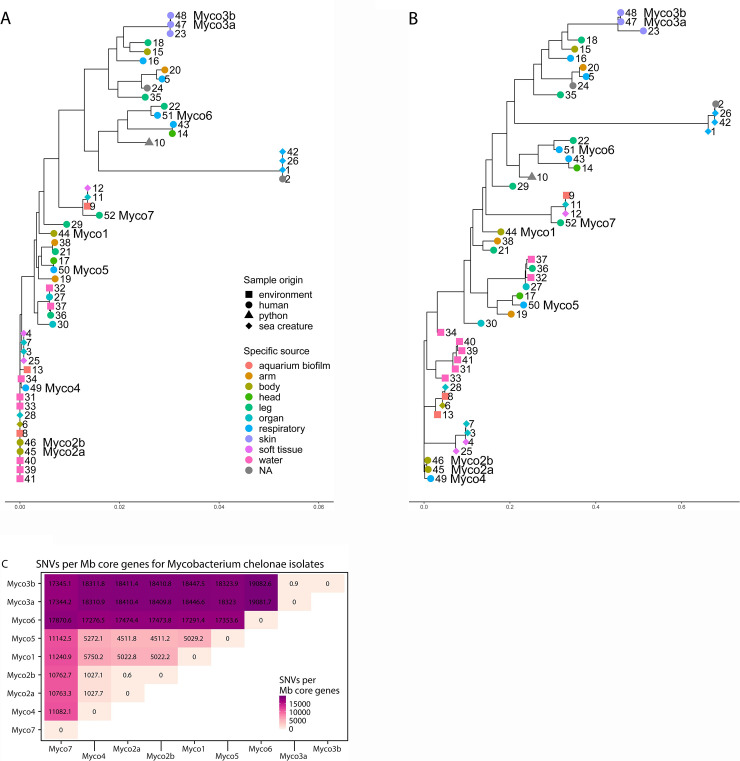
Fig 1. Relationship of M. chelonae genome sequences.
A. A maximum-likelihood phylogenetic tree showing relationships among M. chelonae isolates based on SNVs in the core genes. Numbers next to branch tips correspond with genomes found in S1 Table. Isolates from our study are indicated with “Myco” and the isolate number. The sampling site and host of the isolate is coded by color and shape, respectively, at branch tips. The scale at the bottom represents the number of substitutions per sequence site based on length of the tree. B: Amaximum-likelihood tree showing the relationship among M. chelonae isolates based on presence or absence of accessory genes. C: SNVs per Mbp core genome between M. chelonae isolates. SNVs, calculated as hamming distance between the core genes of all isolates divided by the total length of core genes. Myco2a/2b and Myco3a/3b are technical and biological replicates, respectively.

