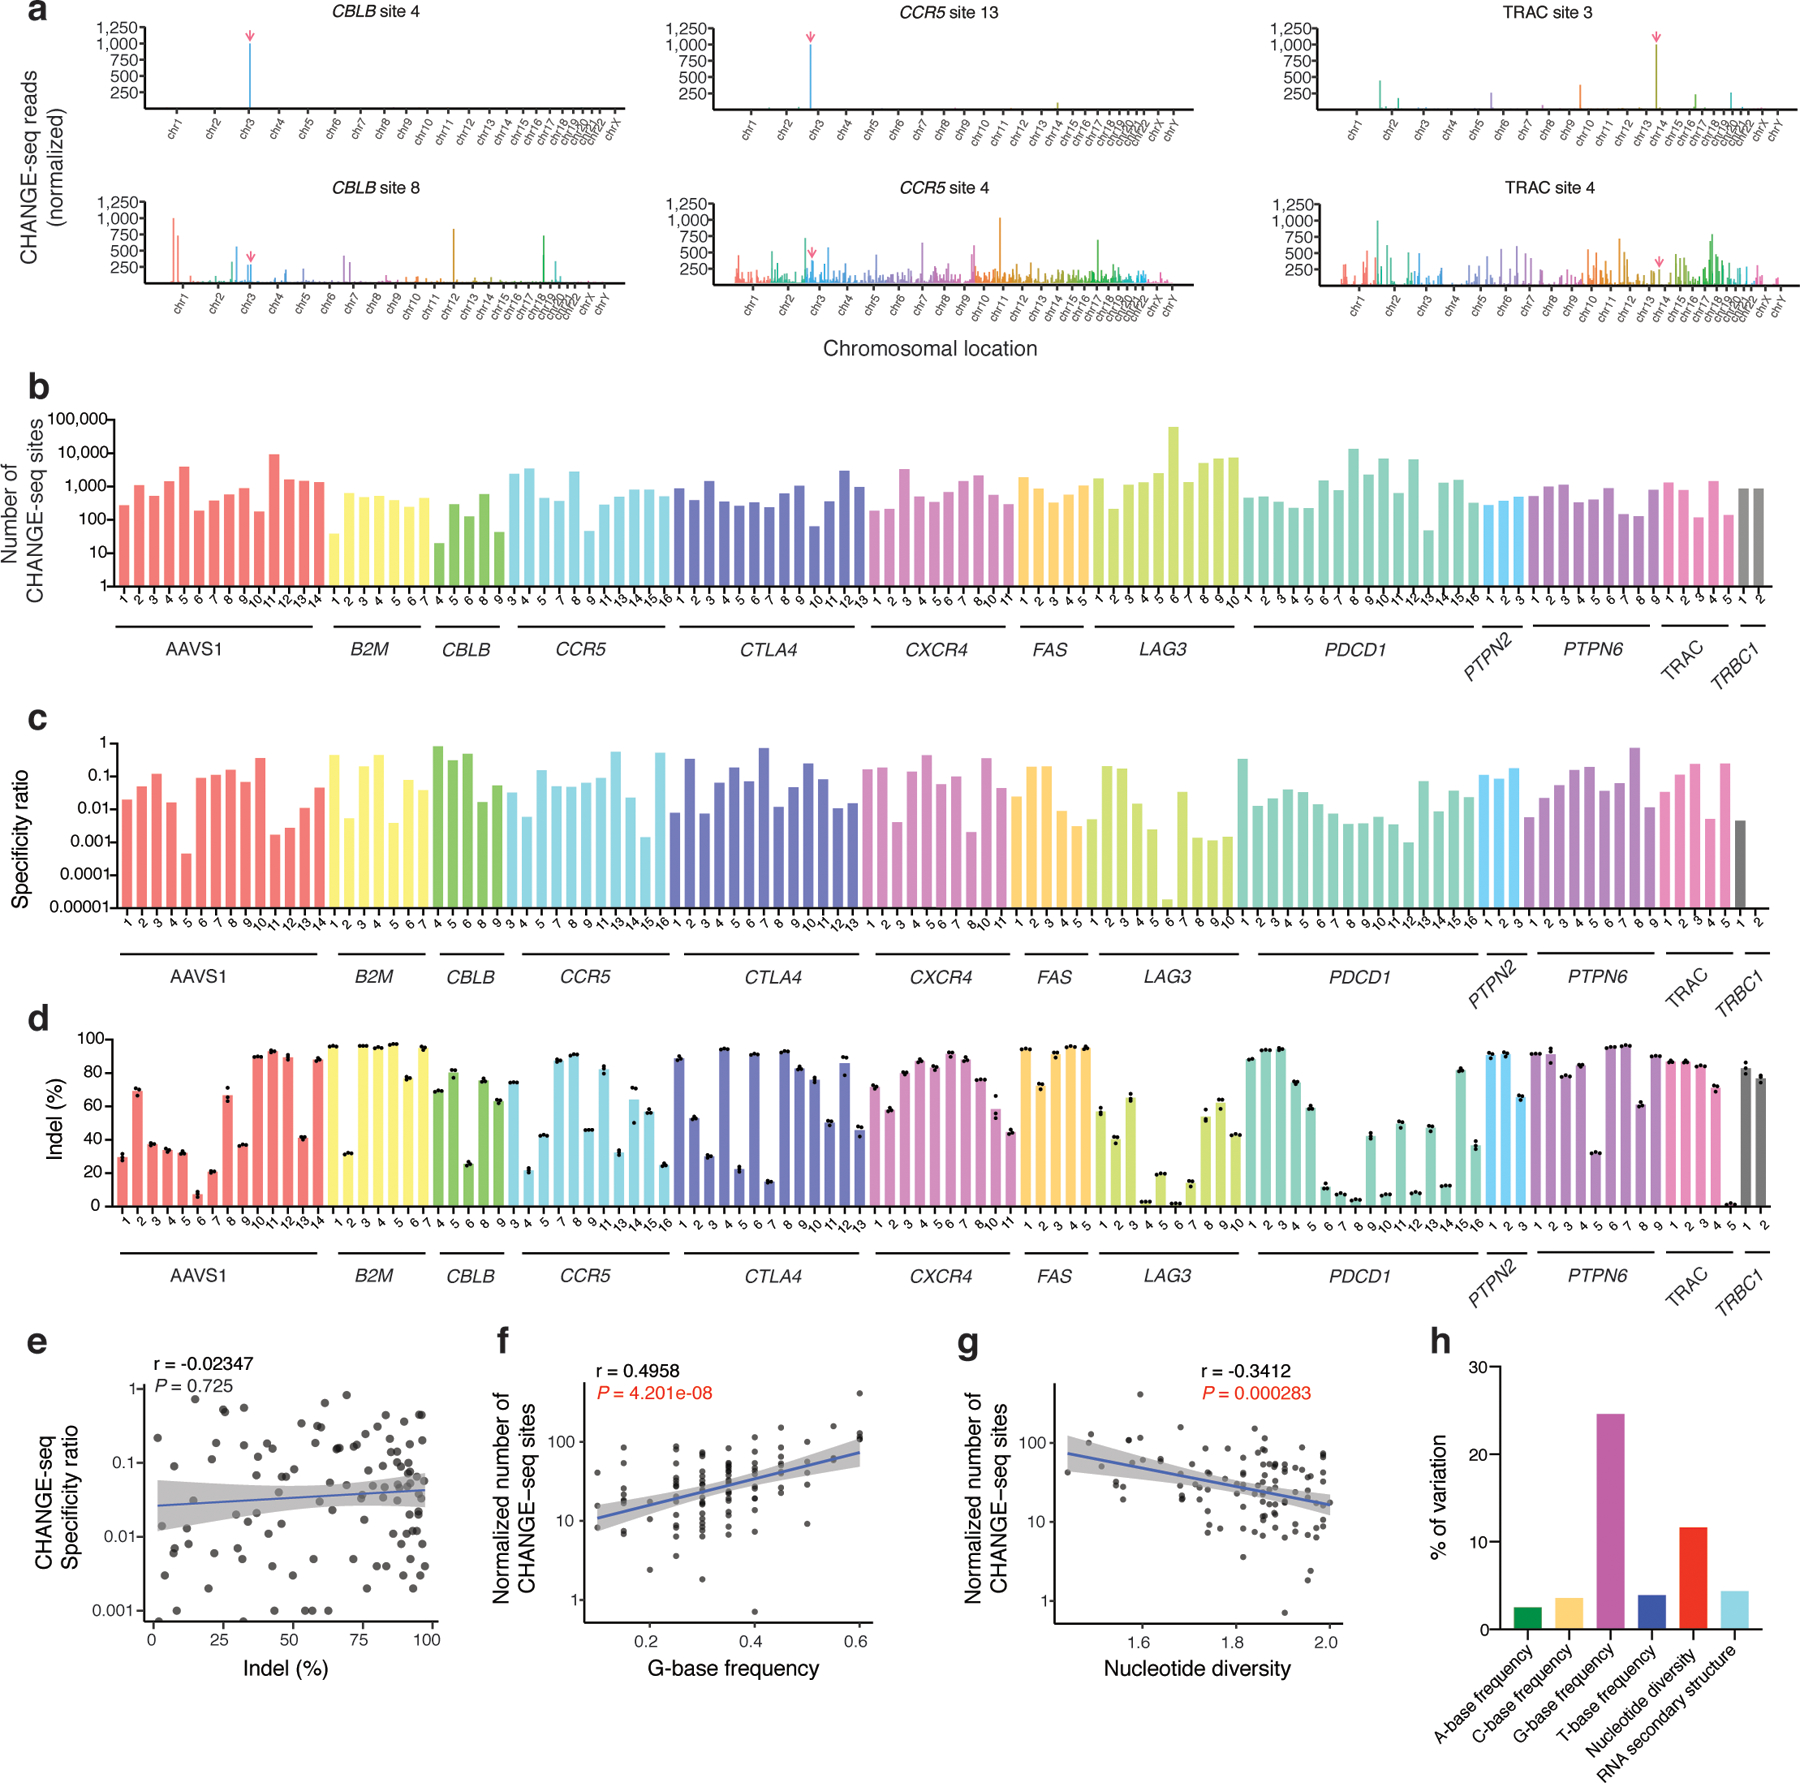
Fig. 2 |. High-throughput CHANGE-seq profiling of 110 therapeutic target sites reveals target site factors that affect Cas9 genome-wide specificity.

a, Manhattan plots of CHANGE-seq detected on- and off-target sites organized by chromosomal position with bar heights representing normalized CHANGE-seq read count. The on-target site is indicated with a red arrow. Examples of target sites with specific (top) and promiscuous (bottom) activity shown for the same locus. b, Barplot of number of CHANGE-seq sites detected for 110 sgRNAs designed toward nonrepetitive target sites across 13 loci in human primary CD4+/CD8+ T-cells (log scale) (n=1). c, Barplot of specificity ratio showing relative specificity of sites (log scale). d, Barplot of indel mutation frequencies for 110 intended target sites measured 3 days post nucleofection with Cas9:sgRNA RNPs (n=3). e, Scatterplot showing correlation of indel frequency at the intended target sites with CHANGE-seq specificity ratio. f, Scatterplot showing correlation of G-base frequency with normalized number of CHANGE-seq detected sites (adjusted by number of homologous genomic sites) (log scale). g, Scatterplot showing correlation of nucleotide diversity with normalized number of CHANGE-seq detected sites (adjusted by number of homologous sites) (log scale). (e-g). Correlation between two samples was calculated using Pearson’s correlation coefficient and two-tailed P value. h, Variance in number of sites detected by CHANGE-seq explained by target site A-frequency, C-frequency, G-frequency, T-frequency, nucleotide diversity and RNA-secondary structure.
