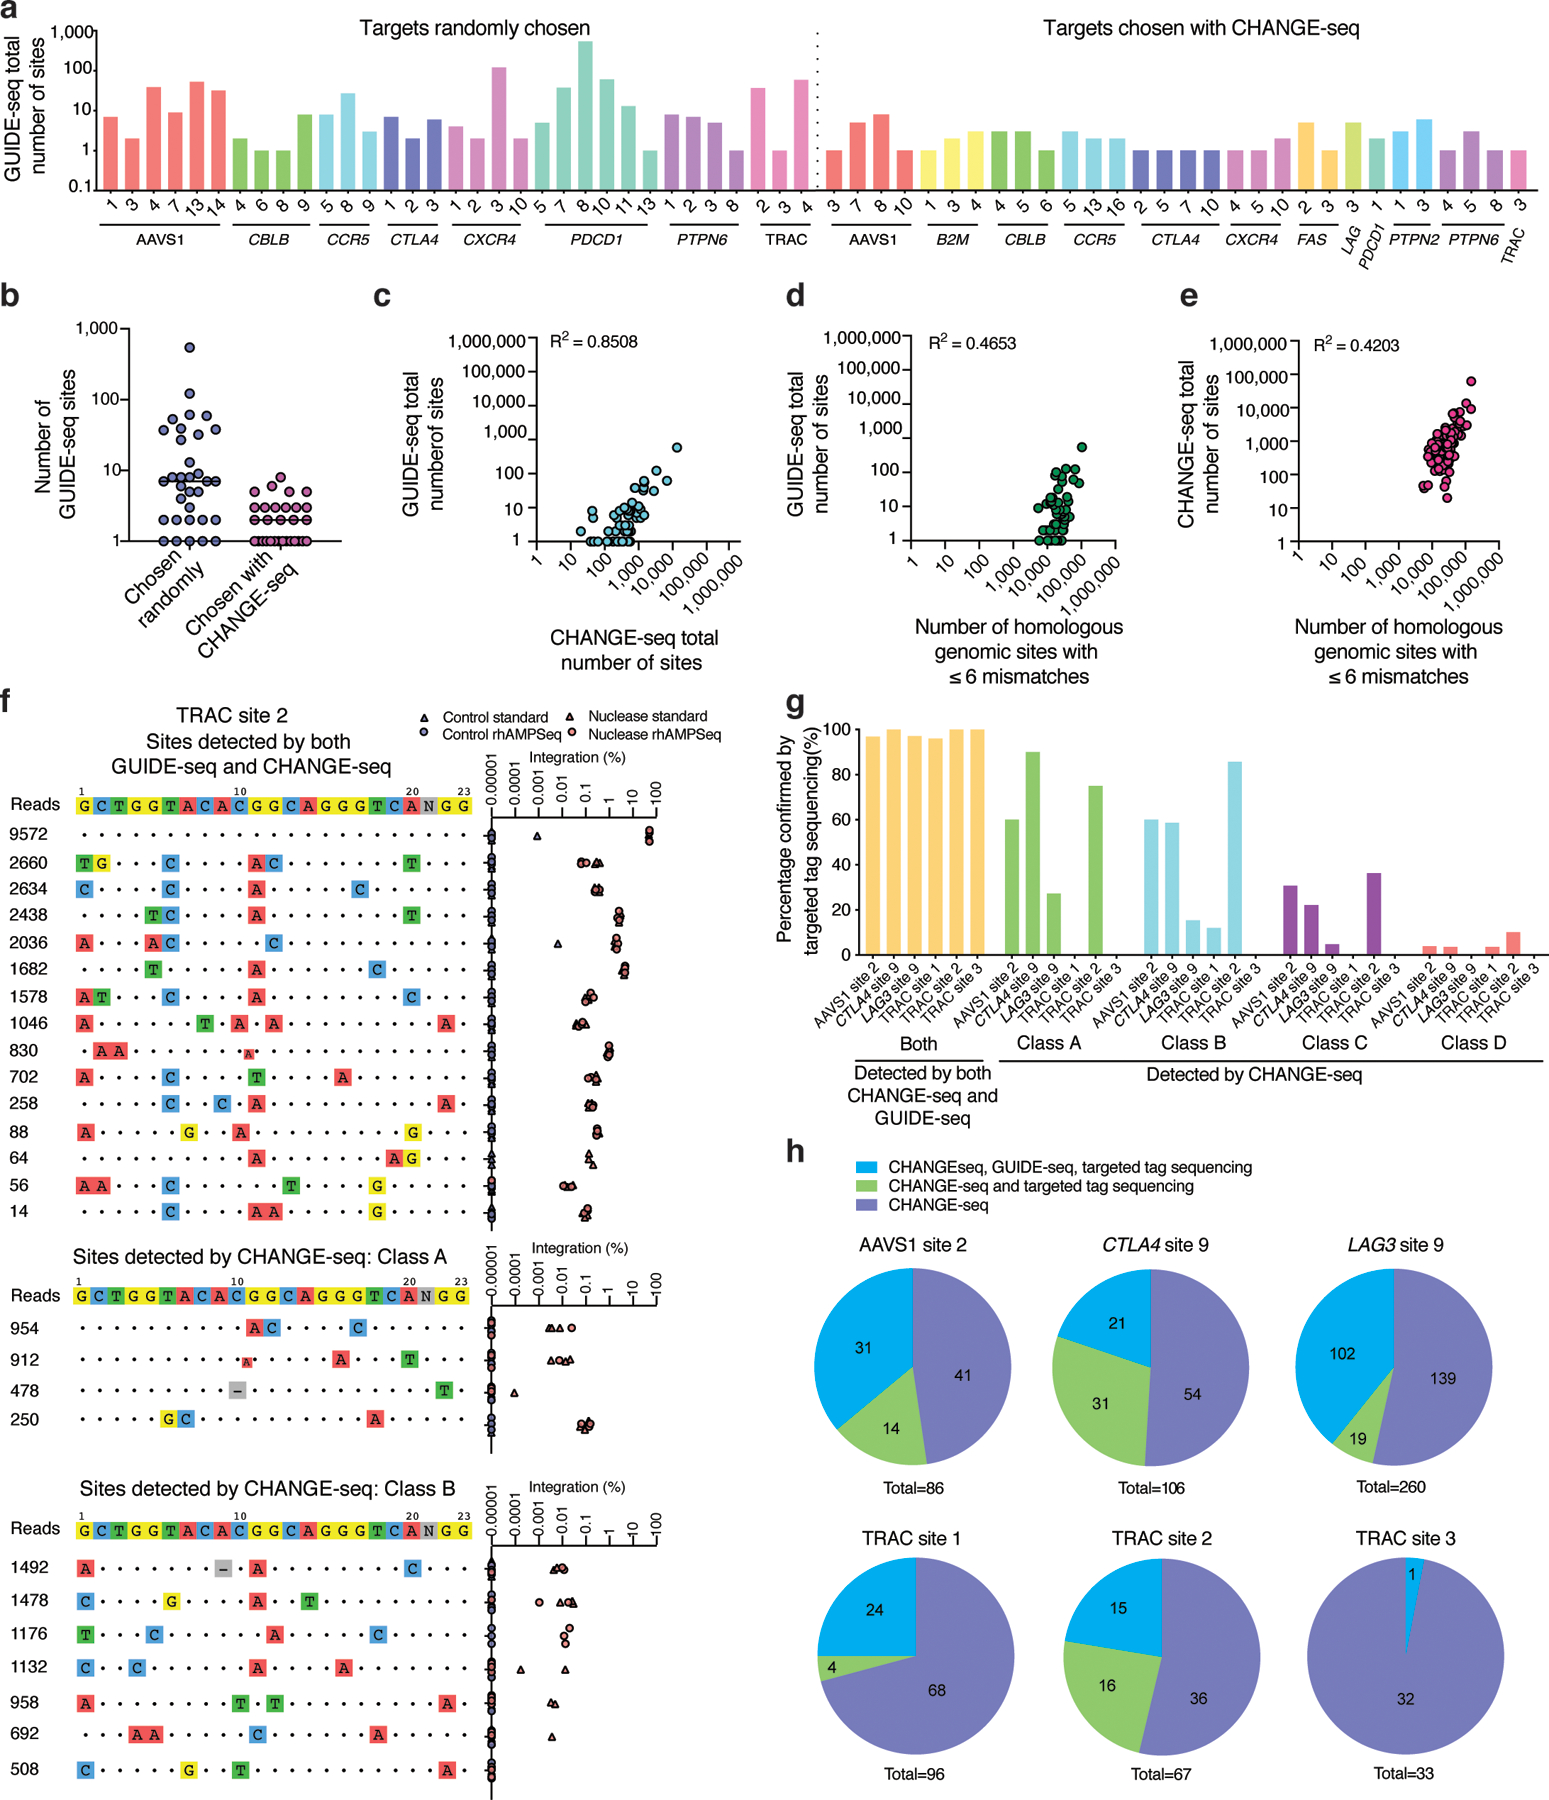
Fig. 4 |. CHANGE-seq genome-wide activity profiles sensitively predict cellular specificity.

a, Barplot showing number of sites detected by GUIDE-seq for both sets of targets (chosen randomly or on the basis of CHANGE-seq), totaling 54 target sites (n=1). b, Dotplot of number of GUIDE-seq sites detected for targets chosen randomly (n=33) and targets chosen based on CHANGE-seq data (n=30), the centered line indicates the median. 9 sites are overlapping between sets. c, Scatterplot showing correlation in number of sites detected by GUIDE-seq versus CHANGE-seq. d, Scatterplots showing correlation in number of sites detected by GUIDE-seq and homologous genomic sites identified in silico (using Cas-OFFinder). e, Scatterplots showing correlation in number of sites detected by CHANGE-seq and number of homologous genomic sites. (c-e) Correlation between two samples was calculated using Pearson’s correlation coefficient. f, Targeted tag integration frequencies evaluated by standard targeted sequencing (triangle shape) and rhAMPSeq (circle shape) at off-target sites detected by both GUIDE-seq and CHANGE-seq (upper panel), and off-target sites detected by CHANGE-seq but not GUIDE-seq (middle and lower panel) for sgRNA targeted to TRAC site 2. g, Barplot showing the percentage of off-target sites confirmed by targeted tag sequencing at sites detected by CHANGE-seq and GUIDE-seq, and Class A, Class B, Class C, or Class D sites detected by CHANGE-seq and not GUIDE-seq. h, Pie charts showing fractions of CHANGE-seq sites evaluated by amplicon sequencing that are also detected by GUIDE-seq and targeted tag sequencing.
