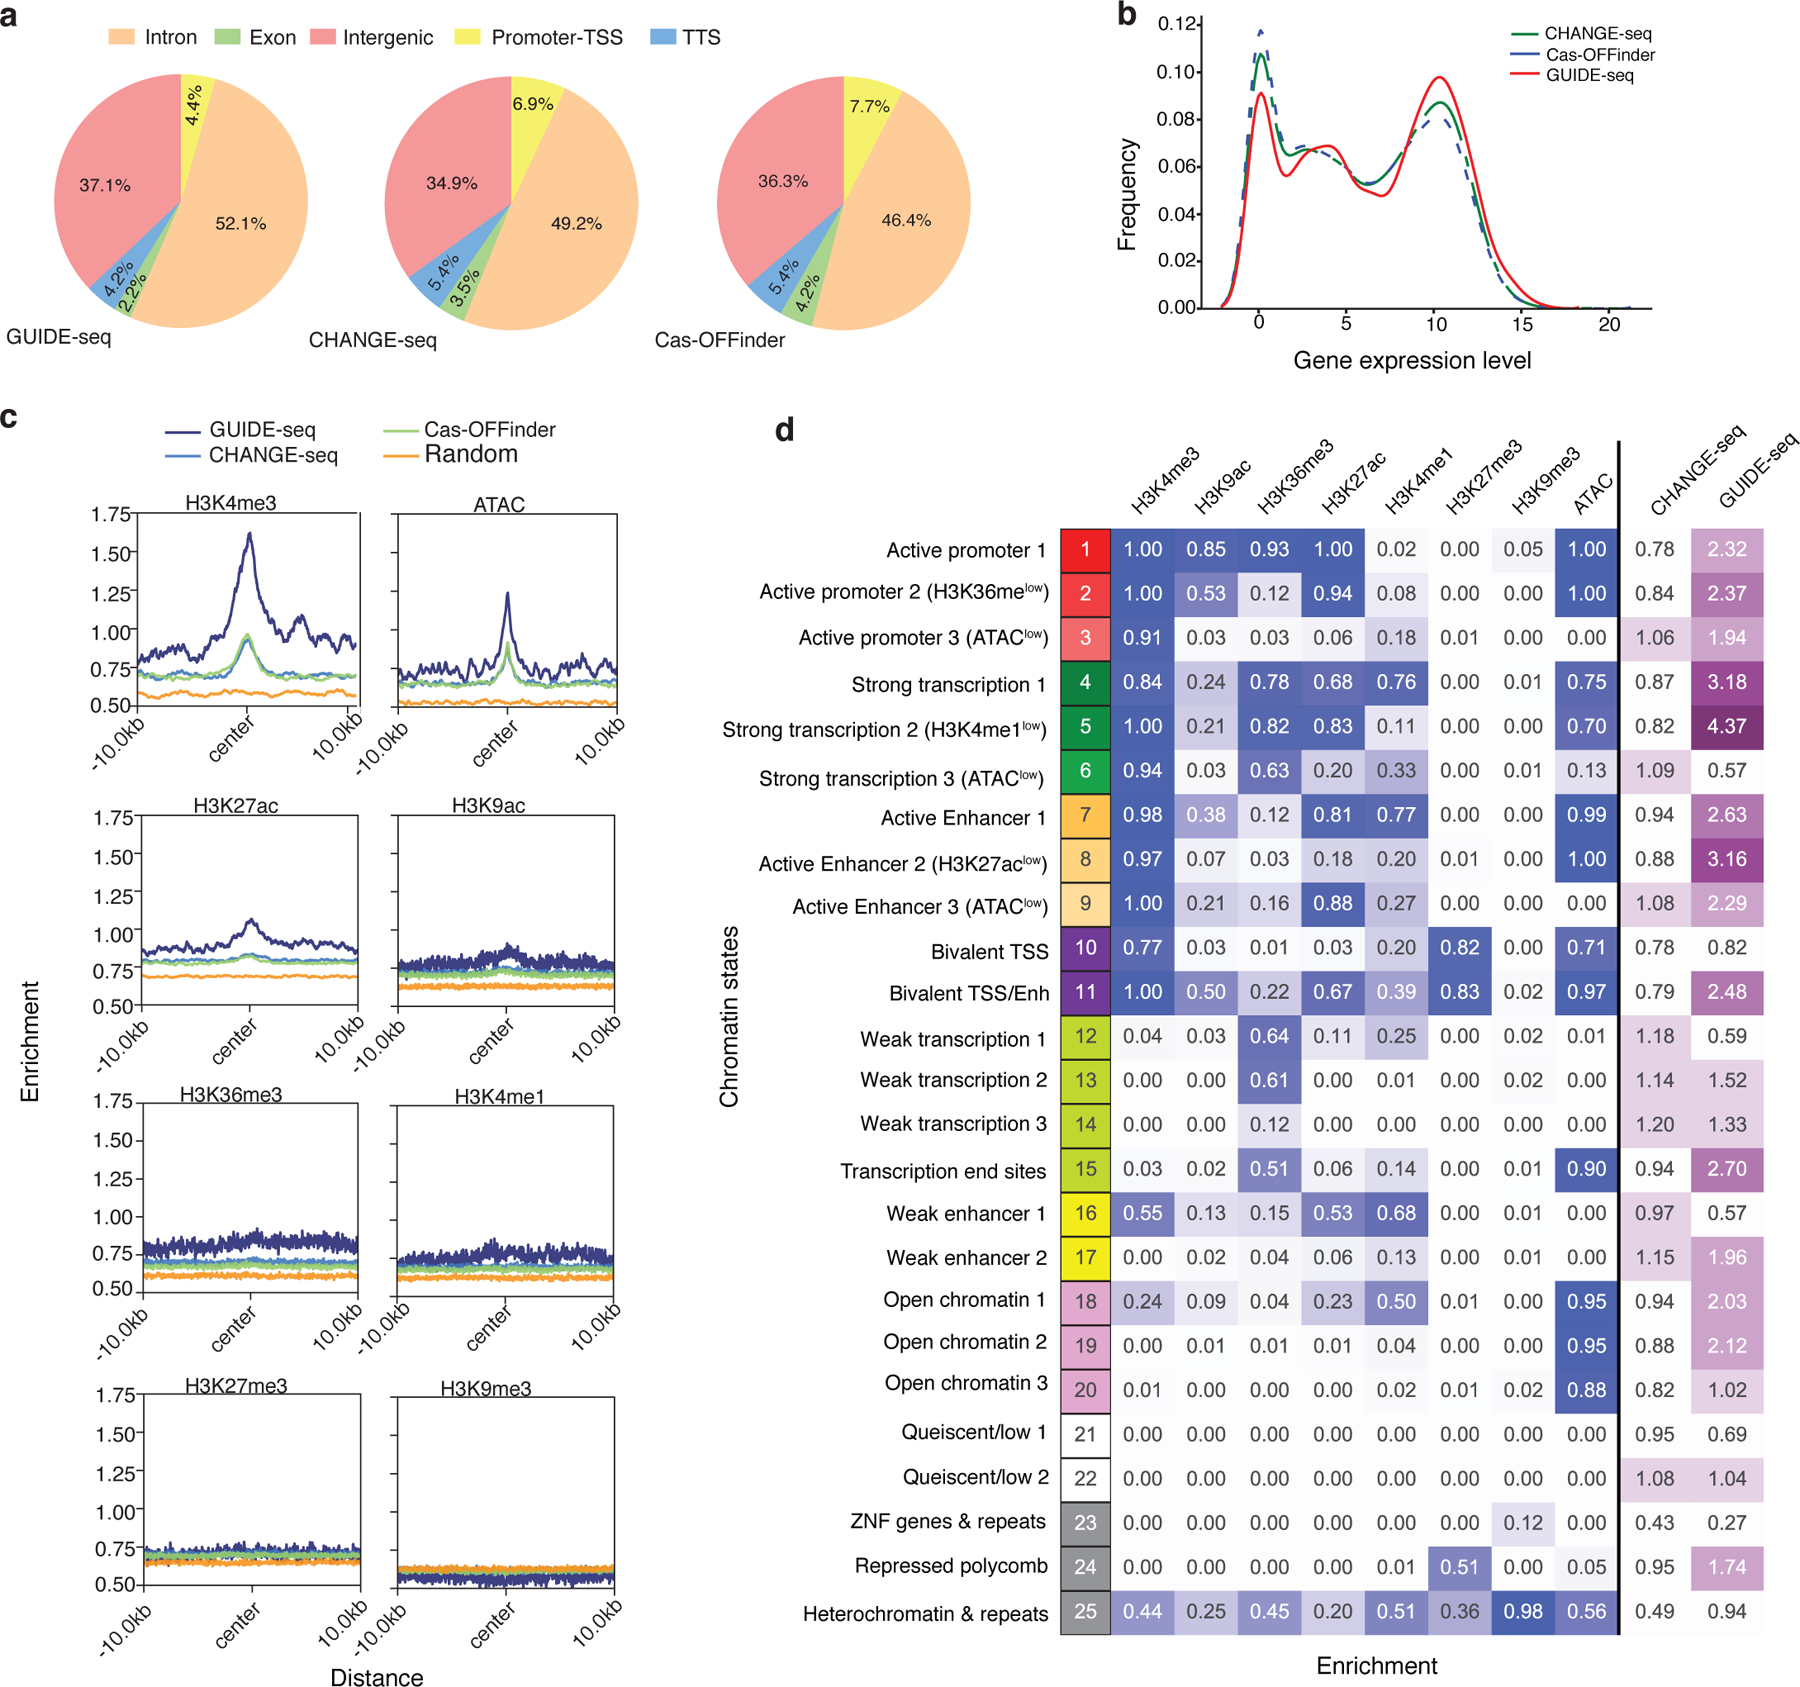
Fig. 5 |. Cas9 off-target activity is enriched in active chromatin states.

a, Pie charts showing fraction of cleavage sites identified by GUIDE-seq (left), CHANGE-seq (middle) and Cas-OFFinder (right) categorized according to their genomic features. TSS: Transcription Start Site. TTS: Transcription Termination Site. b, Kernel density plot showing the distribution of gene expression for CHANGE-seq, Cas-OFFinder, and GUIDE-seq. c, Average of histone modification ChIP-seq and ATAC-seq signal at off-target sites and flanking regions (± 10 kb). d, Heatmap showing emission probabilities (blue) of the 25-state ChromHMM model and fold enrichment of CHANGE-seq (n=11,000) and GUIDE-seq (n=1,196) sites relative to homologous genomic sites (n=11,000) with 6 or less mismatches (purple). Darker colors indicate greater emission probability or enrichment. Chromatin state annotations are shown on the left.
