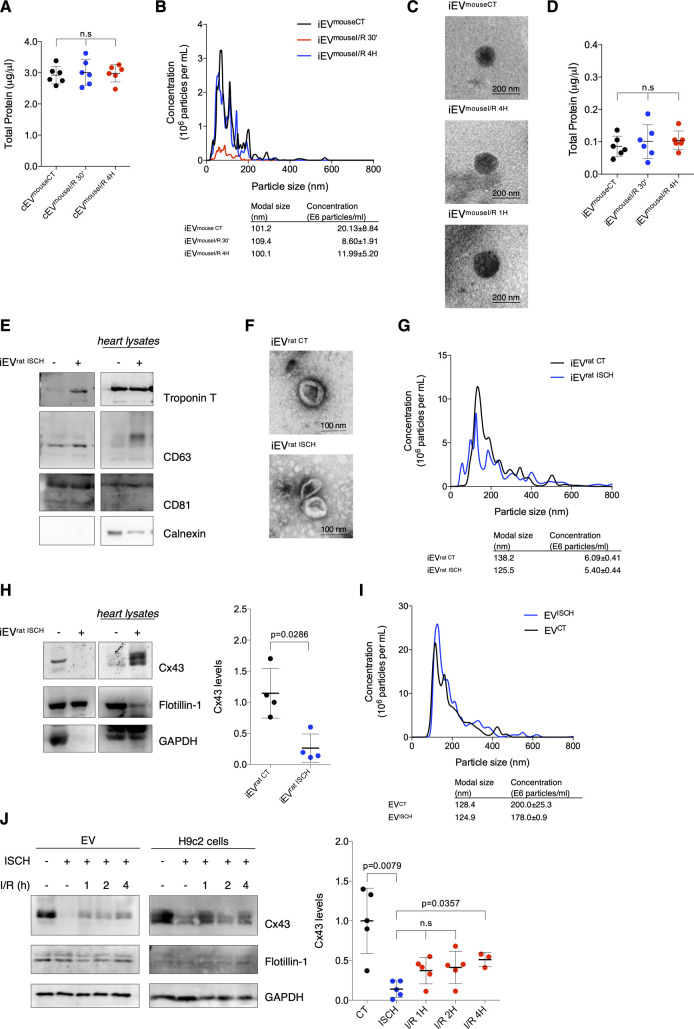
Figure S1. Ischemia decreases secretion of Cx43 into circulating extracellular vesicles (EVs) from mice subjected to myocardial ischemia/reperfusion (I/R) injury and cardiomyocyte-derived EVs.
(A) Total protein quantification of circulating EVs isolated from sham (cEVmouseCT), I/R 4H (cEVmouseI/R 4H) and I/R 30′ (cEVmouseI/R 30′) mice (n = 6). (B) Representative nanoparticle tracking analysis (NTA) of concentration and size distribution of intracardiac EVs obtained from sham (iEVmouseCT), or animals subjected to I/R for 4 h (iEVmouseI/R 4H) or 30 min (iEVmouseI/R 30′). (C) Representative transmission electron microscopy images of mouse-derived intracardiac EVs. (D) Total protein quantification of iEVmouseCT, iEVmouseI/R 4H, and iEVmouseI/R 30′ (n = 6). (E) Intracardiac EVs (5 μg total protein/lane) were isolated from Langendorff-perfused hearts, maintained in control perfusion or subjected to global myocardial ischemia by low flow (iEVrat ISCH). Non-reducing WB for the cardiac marker Troponin T and EV markers CD63 and CD81. (F) Representative transmission electron microscopy images of rat-derived intracardiac EVs. (G) Representative NTA of intracardiac EVs obtained from control (iEVrat CT) or hearts subjected to 30 min of low flow ischemia (iEVrat ISCH). (H) Cx43 levels in EVs isolated from control and ischemic hearts were evaluated by WB (5 μg total protein/lane). Quantification is plotted on graph (n = 4). Analysis of the pan-EV markers Flotillin-1 and GAPDH was also performed. (I) Representative NTA of concentration and size distribution of EVs derived from HL-1 cells subjected to 30 min of ischemia (ISCH). (J) Levels of Cx43 were evaluated in EVs derived from H9c2 cells subjected to ischemia (ISCH) for 30 min, followed by 1, 2, or 4 h of reperfusion (I/R; n = 4). Analysis of the pan-EV markers Flotillin-1 and GAPDH was also performed.

