. 2020 Oct 22;9:e61496. doi: 10.7554/eLife.61496

Figure 1. ClpXP complexes with ssrA degrons.

(A) Side and top views of the composite cryo-EM density from the recognition complex. (B) The upper portion of the panel shows transparent density for the ssrA degron (stick representation) in the recognition and intermediate complexes; the lower portion shows the offset positions of the ssrA degron (space-filling representation) in the channel of ClpX (cartoon representation) in both complexes after removal of subunit F. In this and all subsequent figures, ClpX is colored blue, green, or purple; ClpP is yellow; and substrate is orange/gold.

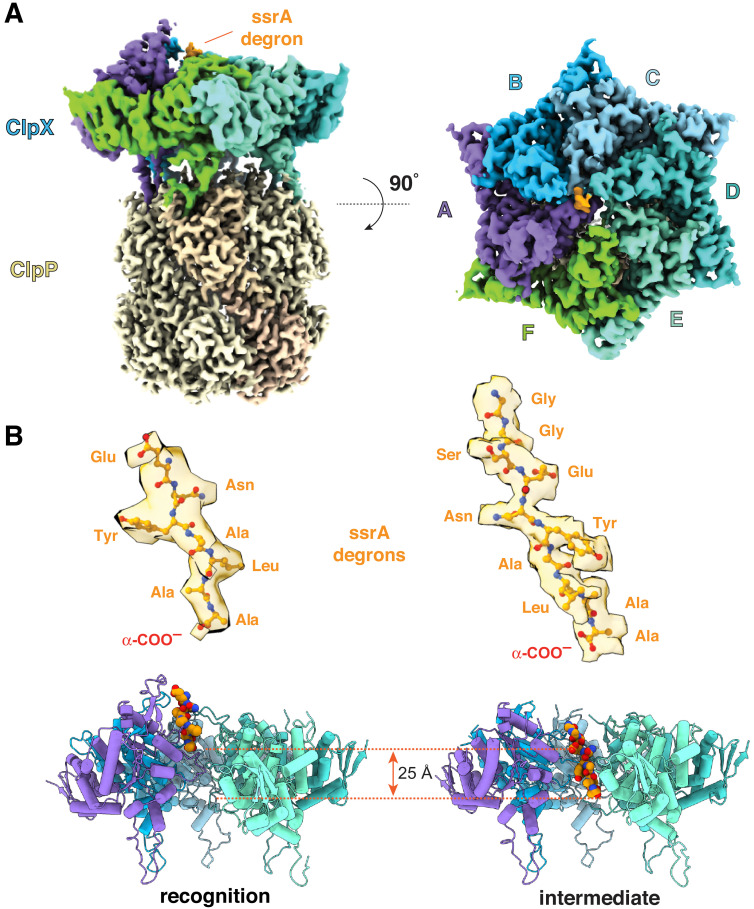
Figure 1.

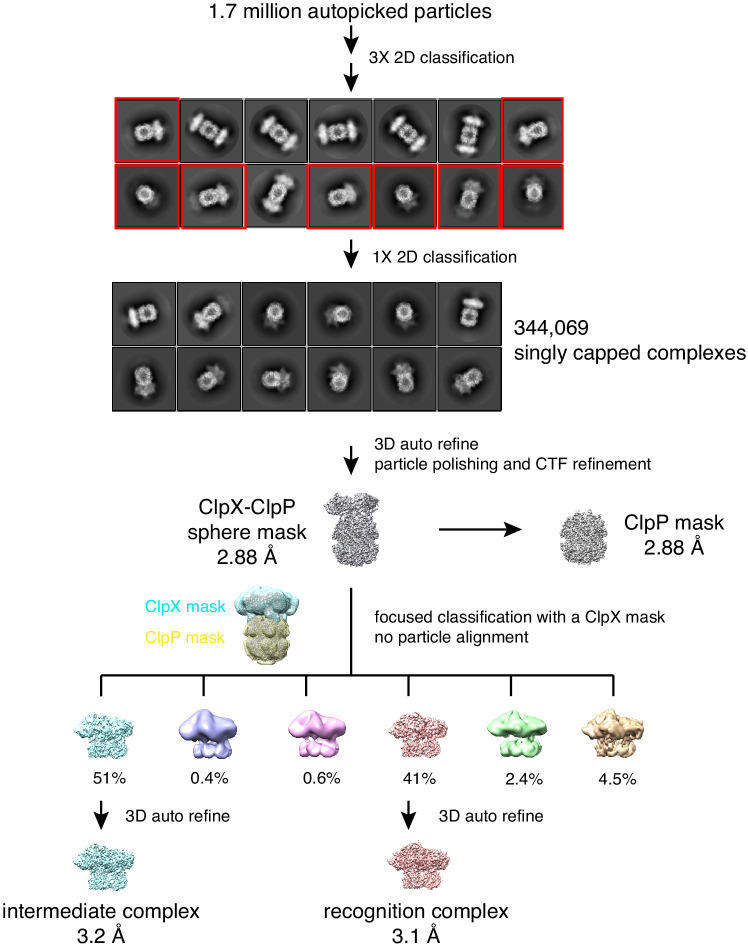
Figure 1—figure supplement 1. Cryo-EM data and strategy.

Figure 1—figure supplement 1.

Data processing workflow. EM images contained singly capped complexes (one ClpX hexamer bound to one ClpP tetradecamer) or doubly capped complexes (two ClpX hexamers bound to one ClpP tetradecamer). Singly capped complex (red boxes) were selected for further refinement and classification. The recognition and intermediate complexes accounted for 92% of all of the singly capped complexes.
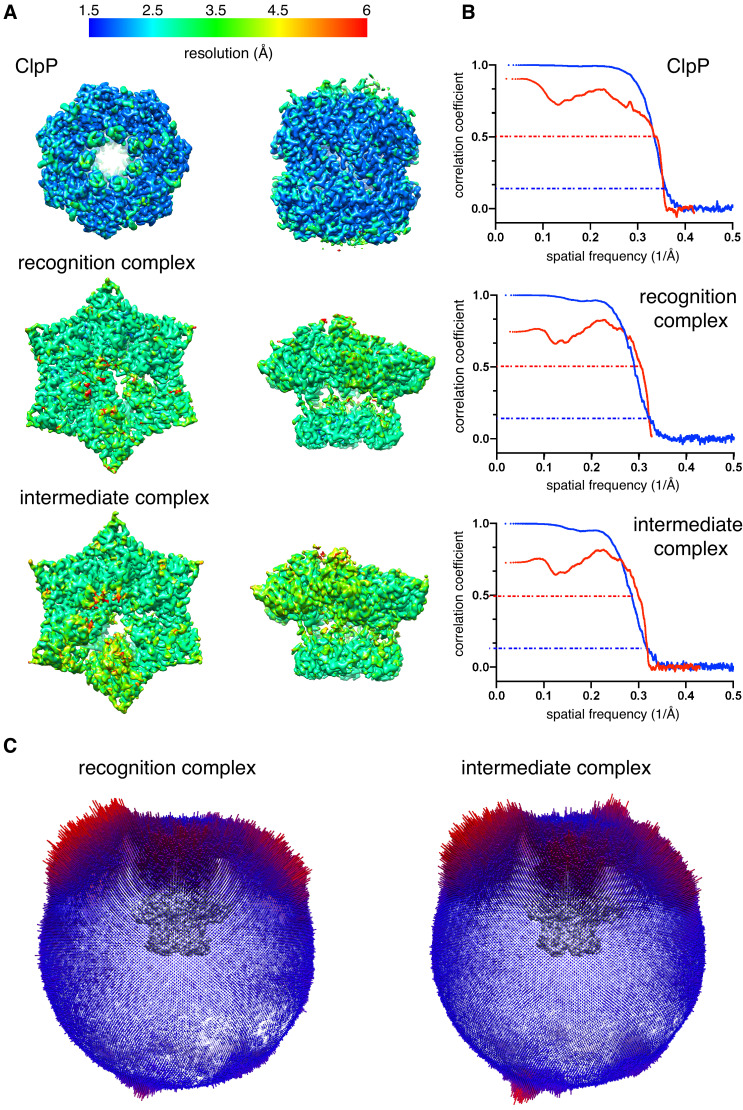
Figure 1—figure supplement 2. Cryo-EM data validation.

Figure 1—figure supplement 2.

(A) Density maps of ClpP, the recognition complex, and the intermediate complex are colored by local resolution. (B) Fourier Shell Correlation (FSC) plots of half maps (blue) or model-map (red). Dashed lines show a cut-off value of 0.143 (blue) or 0.5 (red). Resolutions reported are for a half map FSC of 0.143. (C) Euler-angle orientation distribution for the recognition and intermediate complexes.
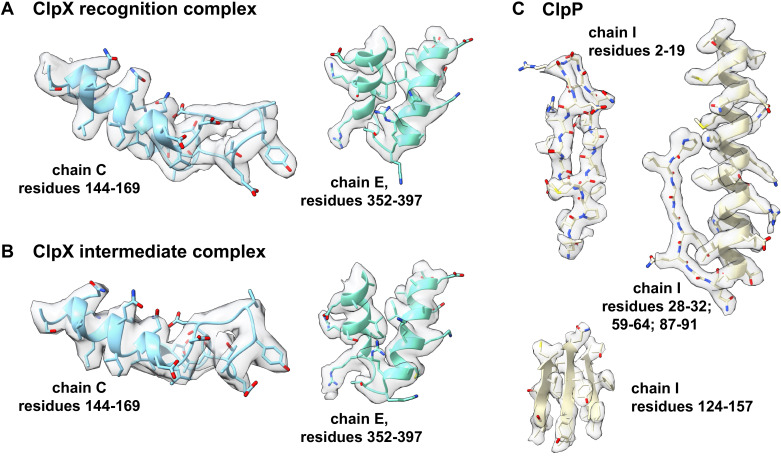
Figure 1—figure supplement 3. Representative density.

Figure 1—figure supplement 3.

Density for portions of the ClpX component of the recognition complex is shown in panel (A); for the ClpX component of the intermediate complex in panel (B); and for ClpP in panel (C).