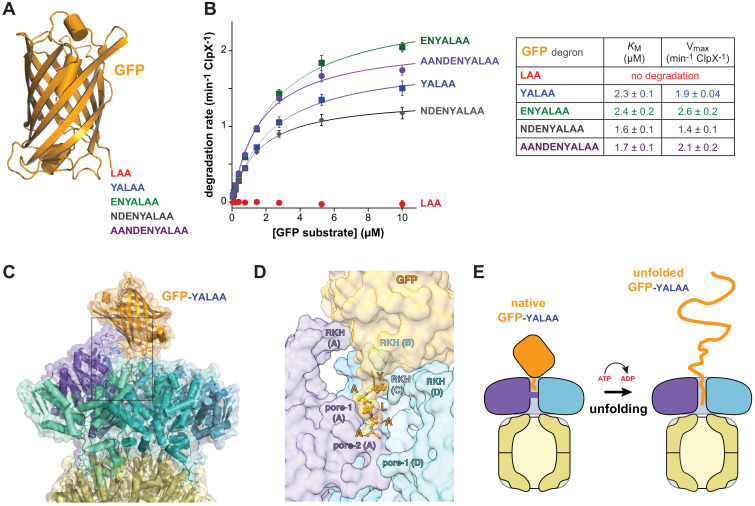
Figure 4. Degradation dependence on degron length.
(A) Cartoon of GFP (pdb 1EMA; Ormö et al., 1996) with degron tails of 3, 5, 7, 9, and 11 residues. (B) Plots of steady-state ClpX∆N/ClpP degradation rates (means ± SD; n = 3) as a function of substrate concentration. Lines are fits to the Michaelis-Menten equation. Fitted KM and Vmax values represent averages of three independent determinations ± SD. (C) Model of GFP-yalaa bound to ClpXP (cartoon and semi-transparent surface representation) created by aligning the yalaa of GFP to the same sequence in the recognition complex and then minimizing clashes both manually and computationally. (D) Close-up view of the ClpX-GFP-yalaa model (subunits E and F removed), corresponding to the dashed rectangle in panel C, with the yalaa shown in ball-and-stick representation. (E) Cartoon in which one power stroke unfolds GFP by translocating the yalaa degron six residues deeper into the channel of ClpX.

