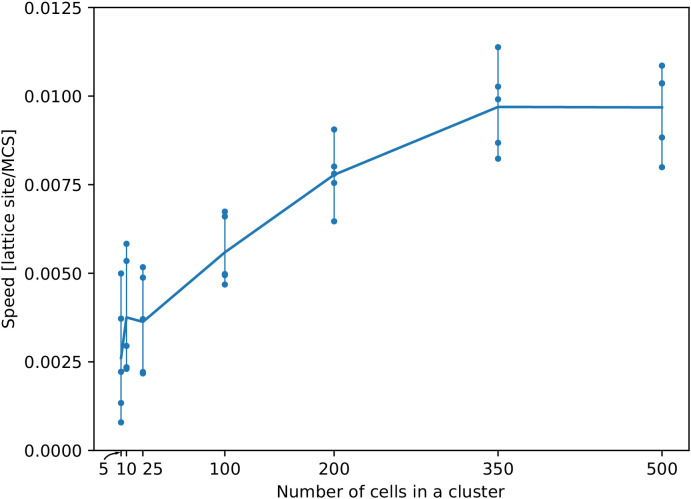
Appendix 1—figure 2. The speed of a cluster towards the peak of the gradient saturates with larger cluster sizes.
For each cluster size, we ran five independent simulations. Each dot corresponds to one simulation. Their average (per cluster size) generates the line. All other parameters as in main text.

