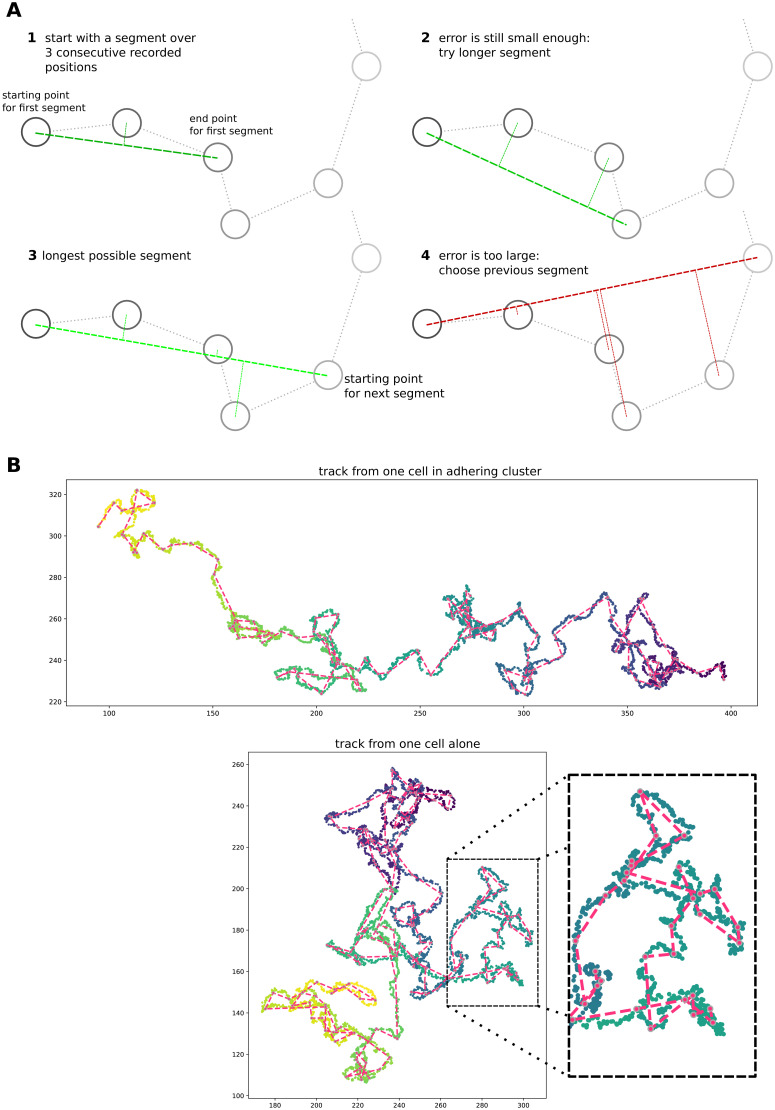
Appendix 1—figure 8. Simple algorithm for segment extraction.
(a) Visual explanation of the algorithm, with a cartoon representation of a cell track with cell positions recorded at regular time intervals. Images 1-4 represent subsequent stages of the algorithm. For 1–3, the maximum distance of intermediate cell positions is still small enough, while for the segment in image 4 two intermediate positions are too far away. So the segment in image 3 will be used in the analysis, and we will start the algorithm from the fourth data point. (b) Two cell tracks from simulations, with the extracted segments superimposed in red.

