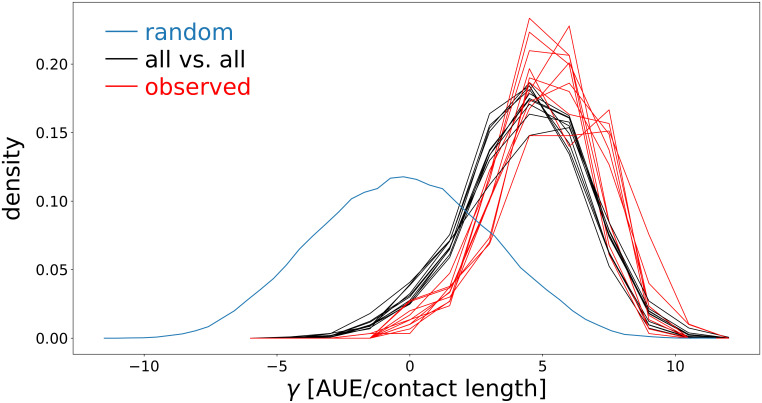
Appendix 2—figure 1. Surface tension distribution for a population of cells that evolve adhesion, compared to the distribution of adhesion strength for randomly generated ligands and receptors.
The data for adhering cells are taken from the same simulation used for main text Figure 5a, over 10 seasons after reaching evolutionary steady state with MCS. Black: all vs. all surface tension distribution (all possible pairwise cell interaction energies tested); red: observed distribution. All parameters are as in main text Figure 5a. Blue: surface tension of random ligand receptors (105 pairs were generated). AUE: Arbitrary Units of Energy (see Table 1).

