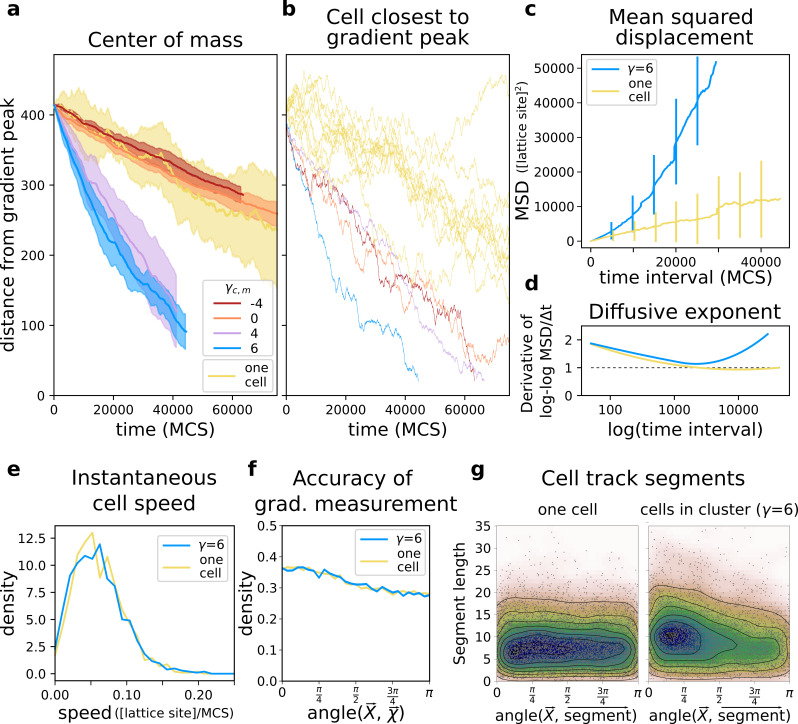
Figure 3. A group of cells performs chemotaxis efficiently in a noisy shallow gradient.
(a) Distance of the centre of mass of cells from the peak of the gradient as a function of time, for different values of (five independent runs for each value), together with the average position of 10 isolated cells (i.e. from simulations with only one cell). (b) The position of the cell closest to the gradient origin as a function of time (taken from the same simulations as in a), and the positions of 10 individual cells (whose average generates the corresponding plot in a). (c) Mean square displacement (MSD) per time interval for two datasets each with 50 simulations of either single cells or clusters of strongly adhering cells (, ), in which case we extracted one cell per simulation. These data sets were also used for the following plots. (d) Diffusive exponent extracted from the MSD plot, obtained from the log-log transformed MSD plots by fitting a smoothing function and taking its derivative (Appendix 1.1). (e) Distribution of instantaneous cell speeds (f) Distribution of angles between cells’ measurement of the gradient , and the actual direction of the gradient peak , as measured from the position of the cell. (g) The length of straight segments in cell tracks vs. their angle with the actual gradient direction. Each point represents one segment of a cell’s trajectory. To extract these straight segments a simple algorithm was used (Appendix 1.8). Contour lines indicate density of data points.

