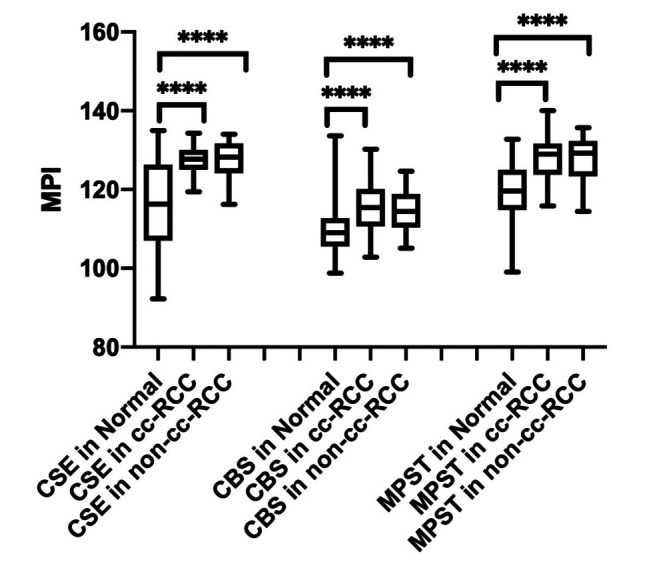
Figure 2. Expression patterns of cystathionine γ-lyase (CSE), cystathionine β-synthase (CBS), and 3-mercaptopyruvate sulfurtransferase (MPST) in normal (N), clear-cell renal cell carcinoma (cc-RCC) and non-cc-RCC tissue. Box and whisker graph of expression in patient-matched biopsies from healthy (normal, n=88) and cancerous (cc-RCC, n=68; non-cc-RCC, n=20) kidney tissues which were fixed, paraffin-embedded, sectioned, and immunohistochemically stained for CSE, CBS, and MPST. Data are presented as the mean±SD of the mean pixel intensity. ****Significantly different at p<0.0001 by two-way ANOVA and Tukey’s post hoc tests.

