. 2020 Sep 3;34(5):2775–2781. doi: 10.21873/invivo.12102

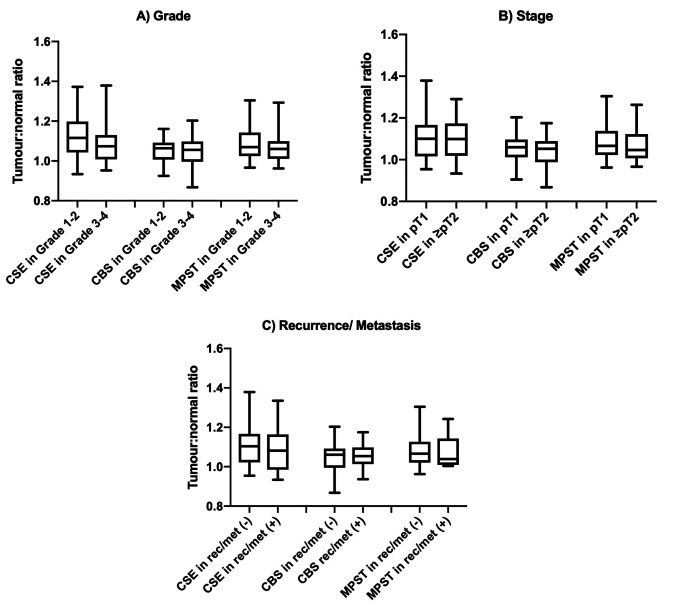
Figure 4. Mean pixel intensity (MPI) ratio of tumour:normal tissue expression of cystathionine γ-lyase (CSE), cystathionine β-synthase (CBS), and 3-mercaptopyruvate sulfurtransferase (MPST). Box and violin graph represented the mean pixel intensity ratio between patients whose renal cell carcinoma scored low (1 or 2, n=40) or high grade (3 or 4, n=46) on the Fuhrman grading system (A), with lower (pT1, n=62) or higher stage (≥pT2, n=26) in the pathology report (B), and whose cancer either did (positive, n=16) or did not (negative, n=72) recur/metastasize in the followup period (C). Data are presented as a ratio of mean tumour:normal pixel intensity±SD. There were no significant differences between groups by two-way repeated-measures ANOVA and Tukey’s post hoc tests.

Figure 4